
 Home
Home News
News

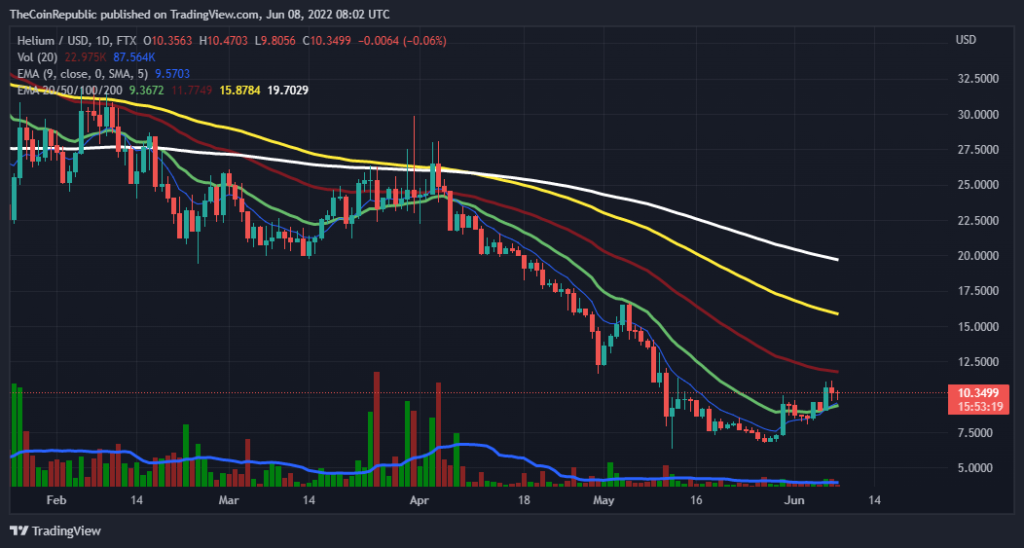
- After a long downtrend movement, the HNT price has started recovering over the daily chart, dominating the bears.
- The crypto asset is trading above the 20, 50, 100, and 200 daily moving average.
- The HNT/BTC pair is at 0.0003382 BTC with a gain of 0.62% in it>
Helium (HNT) is a decentralized blockchain-powered network for the Internet of Things (IoT) devices. Helium aims to improve the communication capabilities of wireless Internet of Things (IoT) devices. Its core appeal will be to device owners and those interested in the IoT space, with financial incentives providing further outreach possibilities.

After a long downtrend movement, the HNT price has started recovering over the daily chart. The coin somehow managed to attract buyers. This recovery was much needed as the coin was trading at its all-time low of 2022. To make a successful recovery through the bears will get in the way of the bulls the HNT bulls need to make continuous efforts. The coin is currently trading above the exponential moving average.

The price for one HNT coin is trading at $10.28 with a gain of 3.59% of its market capitalization in the last 24 hrs. The coin has a trading volume of 34 million with a gain of 14.93% in the 24 hrs trading session and a market cap of 1.2 billion which is at a gain of 3.65% in it. The volume market cap ratio is 0.02857.
Short-term Analysis for HNT
The price is trading at a good uptrend movement over the short-term (4 hrs) graph. Indicating the bulls’ efforts toward the coin. Now the bulls should be consistent with the coin to gain the trust of investors once again. The trading volume has started growing again along with the buyings in support of the bulls.
The MACD indicator indicates a bearish run further as the MACD line is moving below the MACD signal line. The bulls can not ignore this, so they need to take care of the histogram growing red.
The relative strength index is showing an increase in buying, but as the movement is not firm the bulls need to focus on this too as the bears are just looking for an opportunity to break the bull’s efforts.

Conclusion
After a long downtrend movement, the HNT price has started recovering over the daily chart and has a strong uptrend over the hourly graph. The trading volume has started gaining and has increased 14.93% in the last intra-day trading session. The bulls need to take care as the technical indicators are indicating a bearish movement.
Technical levels
Resistance levels: $11.5 and $13
Support levels: $7 and $9
Disclaimer
The views and opinions stated by the author, or any people named in this article, are for informational ideas only, and they do not establish the financial, investment, or other advice. Investing in or trading crypto assets comes with a risk of financial loss.

With a background in journalism, Ritika Sharma has worked with many reputed media firms focusing on general news such as politics and crime. She joined The Coin Republic as a reporter for crypto, and found a great passion for cryptocurrency, Web3, NFTs and other digital assets. She spends a lot of time researching and delving deeper into these concepts around the clock, and is a strong advocate for women in STEM.


