
 Home
Home News
News

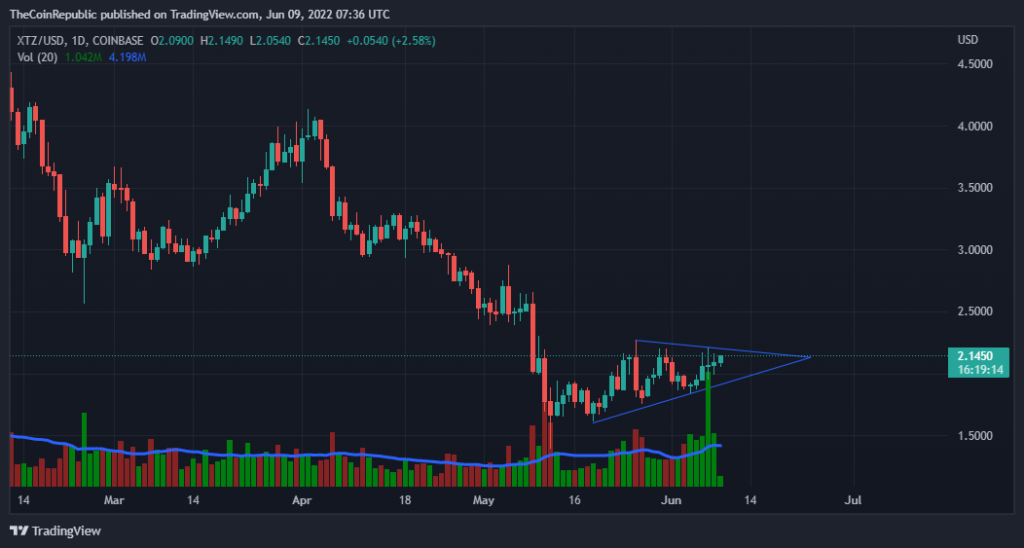
- The price is trading inside an ascending triangle. The bulls are about to make a breakout.
- The crypto asset is trading above the 20, 50, 100 and 200 daily moving average.
- The XTZ/BTC pair is at 0.00007033 with a gain of 5.73% in it.
Tezos is a blockchain network that’s based on smart contracts, in a way that’s not too dissimilar to Ethereum. Tezos has a unique twist on this process. Participants can get involved with the network’s governance through “baking,” where they effectively stake 8,000 XTZ.

The XTZ price is currently trading inside an ascending triangle pattern over the daily chart. The XTZ price is at a slow recovery phase and it needs more buyers to make a breakout over this ascending triangle. The bears are looking for an opportunity to smash the price in order to make a breakdown. The bulls need to make a constant support and should be prepared for the bearish pressure. Analysts believe that if the coin suffered a breakdown, it would be very difficult for the bulls to make the price recover.

The current price for one XTZ is trading at $2.13 with a gain of 5.12% in its market capitalization in the last 24 hrs. The coin has a trading volume of 109 million which is at a loss of 24.89% in the 24 hrs trading session and market cap of 1.9 billion. The volume market cap ratio is 0.05752.
Short-term Analysis for XTZ
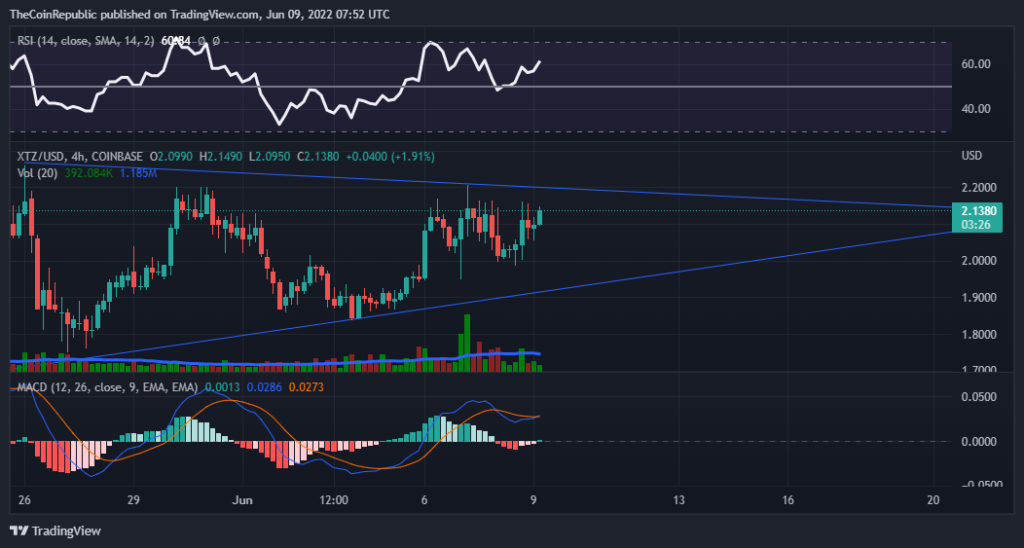
On analyzing the chart for a short term (4 hrs) we can observe an uptrend in the XTZ price. The hourly chart shows us the close fight between the bulls and bears for market dominance. The bulls have an upper hand this time as the price is moving slowly but in an uptrend.
The MACD indicator just now witnessed a positive cross over with the decreasing red histograms and the green ones about to rise.
The relative strength index here is continuously moving upwards indicating the increase in buyings. The RSI value is currently above 60.
If the situation continues the bulls will definitely make a breakout.
ALSO READ – Sequoia Capital rolls out two Web3.0 funds
Conclusion
The XTZ price is currently trading inside an ascending triangle pattern over the daily chart and a slow uptrend over the hourly chart. The bulls need to make a constant support and should be prepared for the bearish pressure. The technical indicators are presently indicating a bullish rally over the hourly graph. The RSI value is above 60 currently.
Technical levels
Resistance levels: $2.40 and $2.60
Support levels: $2 and $1.80.
Disclaimer
The views and opinions stated by the author, or any people named in this article, are for informational ideas only, and they do not establish the financial, investment, or other advice. Investing in or trading crypto assets comes with a risk of financial loss.

Nancy J. Allen is a crypto enthusiast, with a major in macroeconomics and minor in business statistics. She believes that cryptocurrencies inspire people to be their own banks, and step aside from traditional monetary exchange systems. She is also intrigued by blockchain technology and its functioning. She frequently researches, and posts content on the top altcoins, their theoretical working principles and technical price predictions.


