
 Home
Home News
News

- Waves price declined near the 20-day exponential moving average on the 4-hours price chart.
- The bulls are managing WAVES price well above its latest 2022 low of $4.13 which is still important as a vital support level.
- WAVES coin pairing with Bitcoin price is looking neutral at 0.000214 Satoshis.
Waves coin looks stable above its latest 52-week low of $4.13. However, in the last 45 days, the bears have re-examined the area twice. Last night’s daily price candle reflects a bullish hammer candle but the bulls struggle again in an intraday trading session.

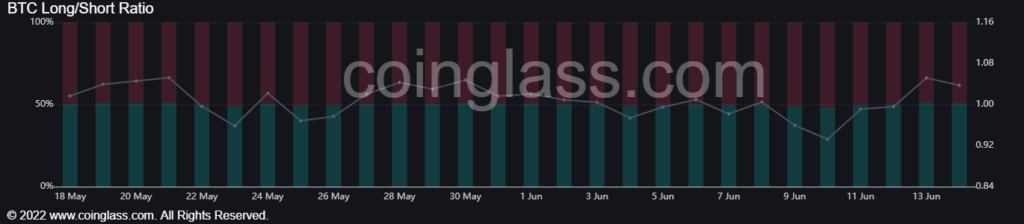
According to data from Coinglass, Waves Coin has a long/short rate of 1.04% in the last 24 hours. Long positions are 50.92% on the other hand short positions are 49.08%. After observing the change in the long/short ratio of the last 24 hours, one can expect the wave price to move higher.

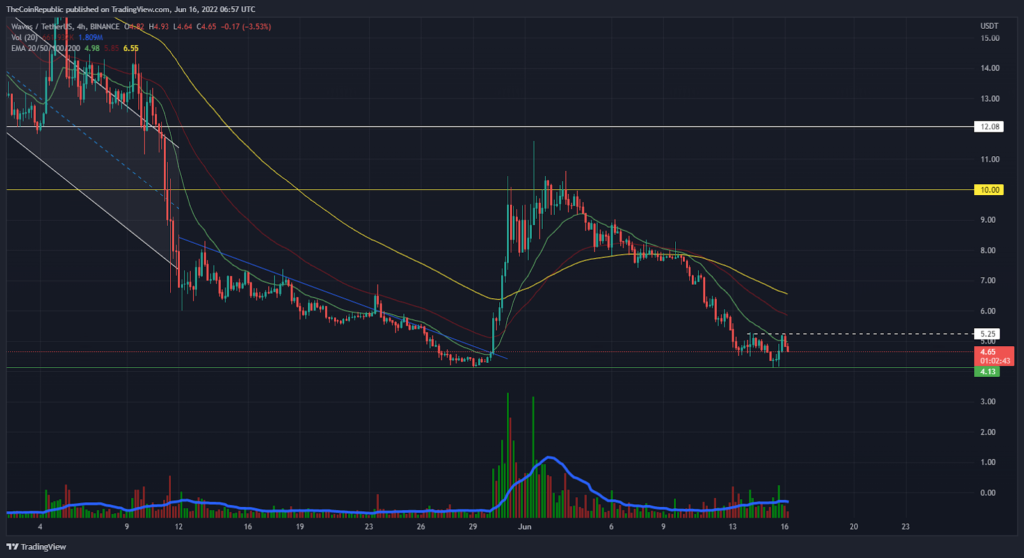
Waves price declined near the 20-day exponential moving average on the 4-hours price chart. Thus the $5.20 to $5.25 area appears to be a bullish barrier for the bulls. Meanwhile, at the time of writing, the WAVES token was trading at the $4.69 mark.
The bears are again aiming to break this support level as soon as possible. Meanwhile, the price of WAVES coin pairing with Bitcoin is looking neutral at 0.000214 Satoshis.
Volatility is less visible than last week. Despite this fact, traders saw an increase of 41% in the last 24 hours.
The RSI is at the door of the highly oversold zone
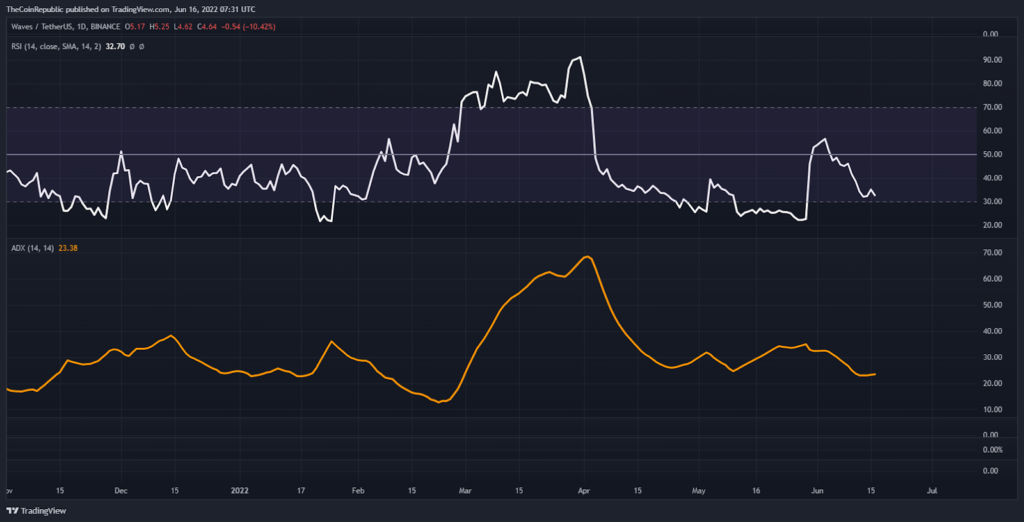
In terms of the daily price chart, the RSI indicator is going to dip into the highly oversold area after slipping from the semi-line. At the same time ADX Waves shows sideways movement for the coin.
Conclusion
Long/Short ratio of WAVES indicates a slight uptrend in the price of the coin but on the other hand, the RSi indicator is about to dip into oversold territory. It now remains to be seen whether the bulls defend themselves from excessive bloodshed or not near the 52-week low.
Support level – $4.2 and 4.0
Resistance level – $10 and $15
Disclaimer
The views and opinions stated by the author, or any people named in this article, are for informational ideas only, and they do not establish financial, investment, or other advice. Investing in or trading crypto assets comes with a risk of financial loss.
Steve Anderson is an Australian crypto enthusiast. He is a specialist in management and trading for over 5 years. Steve has worked as a crypto trader, he loves learning about decentralisation, understanding the true potential of the blockchain.


