
 Home
Home News
News
- Bitcoin Cash Price is consolidating at the 2019 lows and falters to gain support from bulls.
- The crypto asset has fallen below 20, 50, 100 and 200-days Daily Moving Average.
- The pair of BCH/BTC is at 0.006192 BTC with an intraday gain of 5.67%.
Bitcoin Cash price has been falling through some interesting patterns over the daily price chart. As the traditional cryptocurrency, Bitcoin slumps below $20,000 and falters currently at $18000. This bear market crisis is misleading and haunting the cryptocurrency investors. Fear to greed ratio signals extreme fear conditions among the investors. The extreme fear situation will eventually lead the tokens to face peer selling pressure and may shatter the whole cryptocurrency market in pieces. As soon as BTC the greatest dominator starts rallying bearish and paving way for other altcoins. The other altcoins also start following the traditional asset and they also adapt to the bearish momentum. BCH is one of the altcoins whichb falters at the 2019 lows and falters to gain support from bulls. BCH went through some interesting patterns over the daily price chart.

Bitcoin Cash price at first went into a falling parallel channel which acted as a catalyst for the fall of cryptocurrency token. Then BCH consolidated for some time and bulls tried to accumulate and registered the breakout which was a successful accumulation but BCH bulls failed to sustain at the verge of horizontal range-bound area. The token again fell with a steady bearish momentum over the course of the daily time frame. BCH then afterwards again stuck inside a consolidation phase and got rejected with a strong bearish rally. Now the token falters to regain the uptrend momentum over the daily price chart. The token currently falters to gain either of the momentum and is again consolidating at 2019 lows.

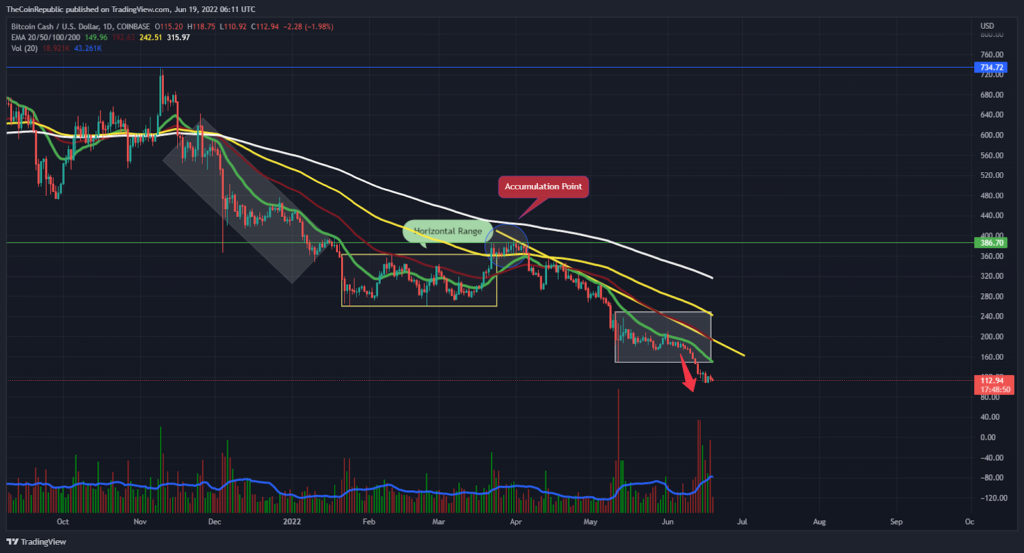
BCH coin price is presently CMP at $113 and has lost 5.91% of its market capitalization in the last 24-hour period. Trading volume has decreased by 5.18% in the intraday trading session. This shows that bears are trying to accumulate to pull the token towards the lower levels. Volume to market cap ratio is 0.8569.
BCH coin price is trying to accumulate support from bulls but looks like it falters at the lower level and is still falling in the intraday trading session. However, volume change can be observed below average and is currently under the influence of bears. Short-sellers are overpowering the situation as BTC slips below $20000 and the whole cryptocurrency market is going through a bloodbath.
Are BCH Investors Prepared for Worst Case Scenario?
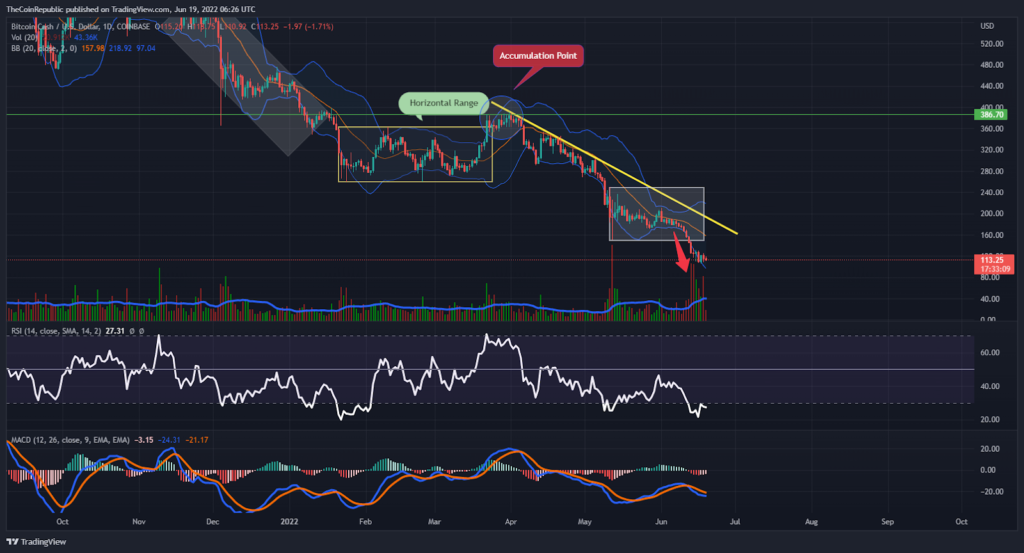
BCH coin price falters at 2019 lows and is trying to accumulate support from bulls. The token must attract more buyers in order to avoid falling into the grave. However, technical indicators suggest BCH is being oversold at the moment. Moreover, the Bollinger band is about to signal a positive sign for BCH coin price action. BCH token price is currently trading at the lower band and it may reverse from current level as soon as it cuts through the lower band. This confirms that BCH investors need to wait until technical indicators suggest any directional change over the daily price chart.
Relative Strength Index showcases the BCH token inside the oversold territory. RSI is at 27 and BCH investors can expect any directional change as soon as RSI returns from the oversold zone.
MACD exhibits the downtrend momentum of BCH coin. The MACD line is below the signal line after a negative crossover.
Conclusion
Bitcoin Cash price has been falling through some interesting patterns over the daily price chart. As the traditional cryptocurrency, Bitcoin slumps below $20,000 and falters currently at $18000. This bear market crisis is misleading and haunting the cryptocurrency investors. Fear to greed ratio signals extreme fear conditions among the investors. volume change can be observed below average and is currently under the influence of bears. technical indicators suggest BCH is being oversold at the moment. BCH investors need to wait until technical indicators suggest any directional change over the daily price chart. RSI is at 27 and BCH investors can expect any directional change as soon as RSI returns from the oversold zone.
Technical Levels
Support Levels: $100 and $75
Resistance Level: $150
Disclaimer
The views and opinions stated by the author, or any people named in this article, are for informational ideas only, and they do not establish the financial, investment, or other advice. Investing in or trading crypto assets comes with a risk of financial loss.

Andrew is a blockchain developer who developed his interest in cryptocurrencies while pursuing his post-graduation major in blockchain development. He is a keen observer of details and shares his passion for writing, along with coding. His backend knowledge about blockchain helps him give a unique perspective to his writing skills, and a reliable craft at explaining the concepts such as blockchain programming, languages and token minting. He also frequently shares technical details and performance indicators of ICOs and IDOs.


