
 Home
Home News
News

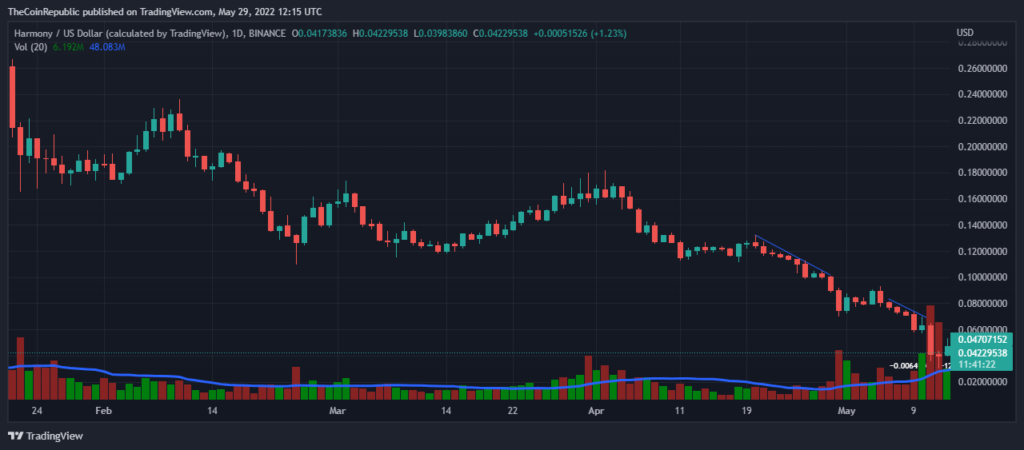
- The Harmony price graph is in a downtrend over the daily time frame.
- The price is moving below the 20, 50, 100, and 200 daily moving average.
- The ONE/BTC pair is at 0.000001439 BTC with a loss of 1.15%.
Harmony is a blockchain platform designed to facilitate the creation and use of decentralized applications. Focusing on processing speed and validation, the Harmony mainnet aims to revolutionize block creation. By introducing the sharding process, the company reduced node validation times significantly.

The Harmony price graph is in a downtrend over the daily time frame. The bear gang is dominating the market. Looks like the bulls are waiting for a good time to make a swing entry. The bulls need to do so really quickly as the price has already degraded much. The coin needs to accumulate buyers to escape this downward trend, but from now the situation will be difficult for the bulls as the price fell down very much. The selling volume has gained very much in the past few days. This can be a very good opportunity for the ones who were waiting to enter the market.

The current price for one ONE coin is $0.040 with a loss of 12% in its market capitalization in the last 24 hrs. The ONE has a trading volume of 97 million and a market cap of 568 million. The volume and market cap ratio for ONE stands at 0.1720.
Short term Analysis
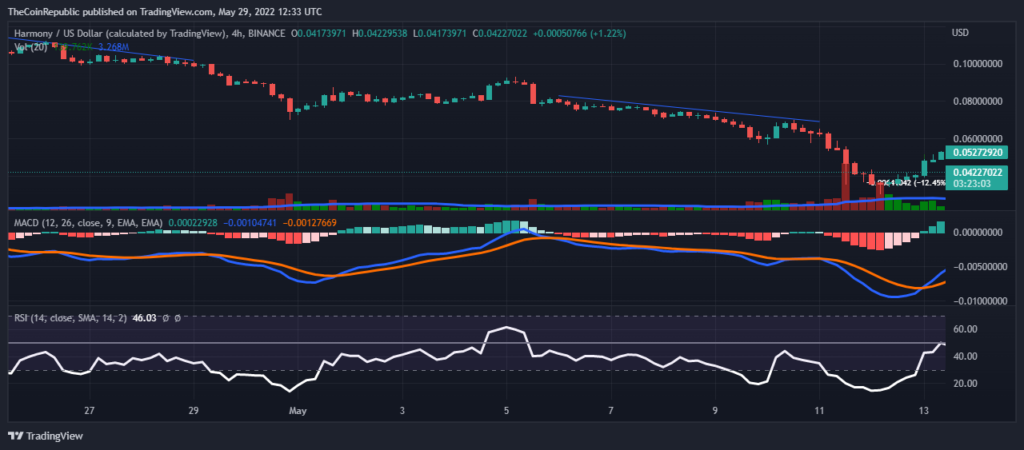
While analyzing the short-term (4 hrs) graph we can observe a trend reversal there, it looks like the bulls are taking interest in buying the dip. If this bullish rally continues soon the coin will recover its price.
Technical indicators like MACD give a signal of bullish movement as the MACD line just made a positive cross over the MACD signal line, the histograms are rising big green indicating the increase in buying.
The relative strength index is also taking an opposite movement from the selling trend. Now indicating an increase in buying. The RSI value for ONE is above 45.
Conclusion
The Harmony price graph is in a downtrend over the daily time frame. The bear gang is dominating the market. The selling volume has gained very much in the past few days. The price is moving below the 20, 50, 100, and 200 daily moving average.
Technical levels
Resistance levels: $0.060 and $0.070.
Support levels: $0.030 and $0.020
Disclaimer
The views and opinions stated by the author, or any people named in this article, are for informational ideas only, and they do not establish financial, investment, or other advice. Investing in or trading crypto assets comes with a risk of financial loss.
ALSO READ: Neo Network Implements Network Upgrade While Its Development Activity Is A Steady Uptrend

Andrew is a blockchain developer who developed his interest in cryptocurrencies while pursuing his post-graduation major in blockchain development. He is a keen observer of details and shares his passion for writing, along with coding. His backend knowledge about blockchain helps him give a unique perspective to his writing skills, and a reliable craft at explaining the concepts such as blockchain programming, languages and token minting. He also frequently shares technical details and performance indicators of ICOs and IDOs.


