
 Home
Home News
News

- The Shiba Inu is yet to go down as the market leader – bitcoin breaks its 52-week low.
- With regard to the 4-hours price chart, SHIB price is struggling to rise above the support line of the Bollinger Bands indicator.
- During the sell-off, speculators saw a drop of over 28% in its trading volume as compared to the previous night.
Due to low liquidity in the Shiba INU, the bulls are unable to manage the price of the altcoins in the green zone. As a result, the SHIB price has been underperforming for a long time.

During the sharp sell-off, SHIB investors have lost around 40% in the last 18 days. Meanwhile, again SHIB sellers are aggressive to drag the altcoin to its recent 2022 lows.

SHIB on 4-hours price chart
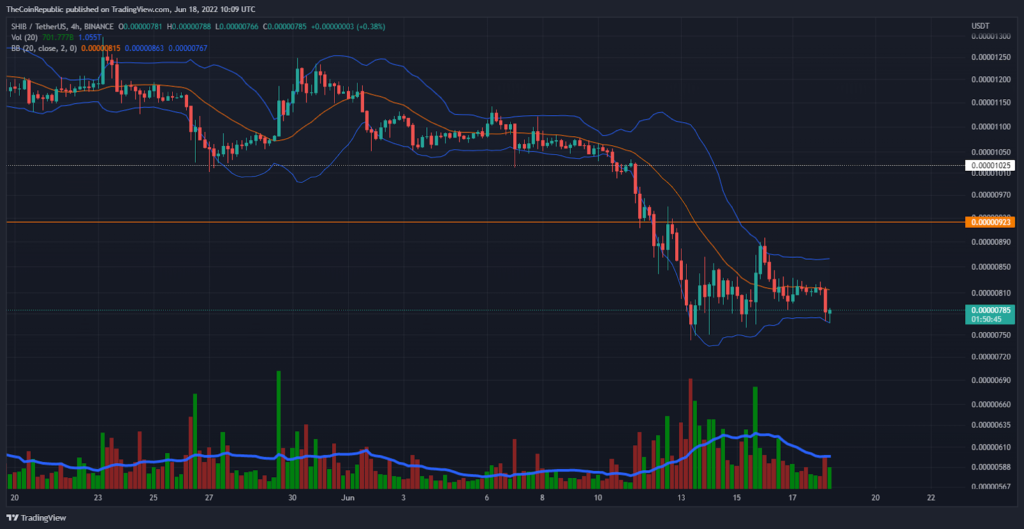
At the time of writing, Shiba INU is trading at $0.00000782 mark with a retracement phase in an intraday trading session. Moreover, the SHIB pair with bitcoin price is in the green zone with a decline of 4.6% by 0.000000000408 satoshis.
Recently SHIB price slipped from resistance BB Indicator with reference to 4-hours graph and now SHIB price is struggling to recover above support line of Bollinger Bands indicator. However, the price action of SHIB forms high-lows during heavy selling.
As investors keep the SHIB price above the support level, the market cap is over $4.3 million as per CMC data, but the SHIB bulls have lost around 4.4% of the cost in the last 24 hours.
Trading volume shows low volatility as the daily volume bars remain below the moving average. Thus, during the sell-off, speculators saw a drop of over 28% in its trading volume compared to the previous night.
SHIB on daily price scale
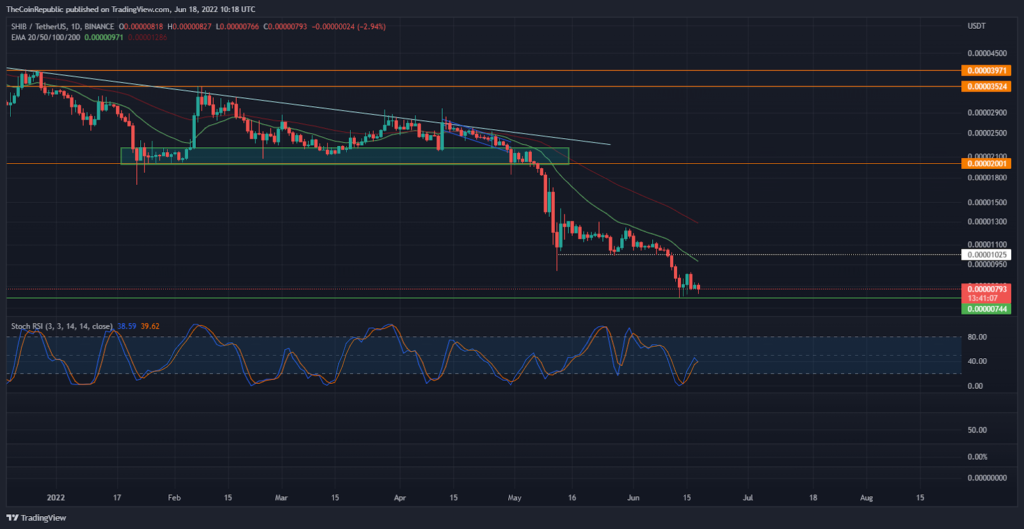
On the daily price chart, the 20-day exponential moving average was a key resistance area before the 50 EMA for the SHIB token.
On the other hand, Stoch RSI is slightly bullish as it starts to move upwards again.
Conclusion
As we all know BTC recently broke $20K so the uncertainty has reached its peak. Any drop below $19K in BTC could propel the altcoin price towards another low.
Support level – $0.0000070 and $0.000005
Resistance level – $0.000010 and $0.000013
Disclaimer
The views and opinions stated by the author, or any people named in this article, are for informational ideas only, and they do not establish financial, investment, or other advice. Investing in or trading crypto assets comes with a risk of financial loss.

Andrew is a blockchain developer who developed his interest in cryptocurrencies while pursuing his post-graduation major in blockchain development. He is a keen observer of details and shares his passion for writing, along with coding. His backend knowledge about blockchain helps him give a unique perspective to his writing skills, and a reliable craft at explaining the concepts such as blockchain programming, languages and token minting. He also frequently shares technical details and performance indicators of ICOs and IDOs.


