
 Home
Home News
News

- Bitcoin Cash price is still looking sideways on the daily price chart, but the 4-hours chart price action is showing a slight bullish trend.
- While forming a higher-lows formation, the bulls struggled for a move higher near the 20-day exponential moving average on the 4-hours graph.
- The Bitcoin Cash and Bitcoin pair is down 3.9% at 0.005748 Satoshis.
However, the entire crypto market is extremely bearish as bitcoin noted an 18-month low near the $17708 mark. Meanwhile, BTC attempted a relief rally above $20K today, but the Bitcoin Cash coin is still sideways.

The $100 conceptual round level, managed by BCH bulls well during the downtrend, still stands as an important hedge area for buyers. Thus bitcoin cash price is still looking sideways on the daily price chart, but the 4-hours chart price action is showing a slight upward trend with a bullish trend (blue).

BCH on 4-hours Graph
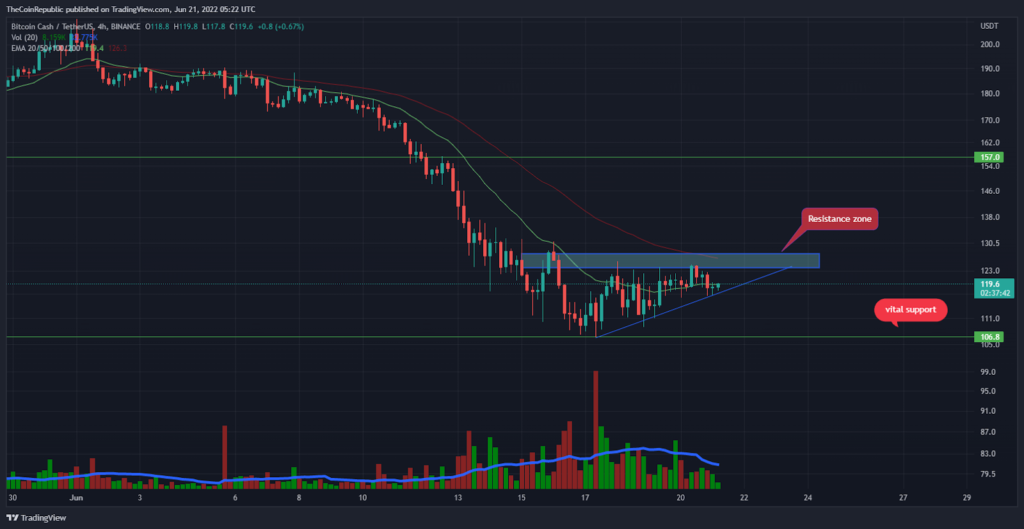
On the 4-hours price scale, the bulls are struggling with an ascending triangle pattern near the resistance area (blue box). Meanwhile, at press time, the altcoin trades at the $120 mark.
Now the bulls are attempting to manage cost of BCH above the 20 EMA, which is slightly bullish on the 4-hours graph. But near the 50 EMA, a return to the bullish trend is expected.
Among range-bound markets, according to CMC, the market cap of BCH increased by 0.9% to $2.2 billion in the past 24 hours. Also the bitcoin pair is down 3.9% at 0.005748 satoshis along with bitcoin cash.
Since June 17, trading volume has plummeted and hit a 20-day low. A bullish rally can be expected when the volume bar rises above the daily average moving line (blue).
BCH on daily price chart
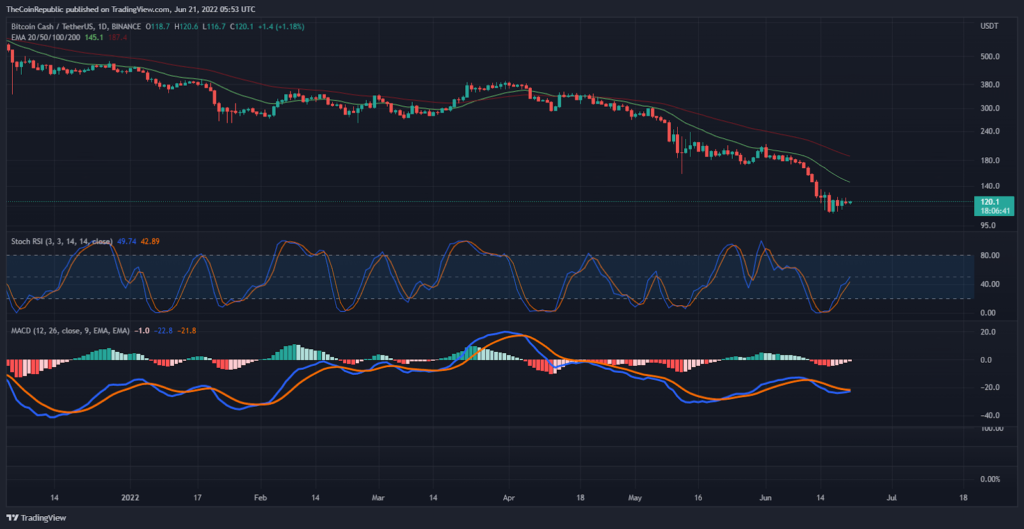
In terms of the daily price chart, BCH price is well below the 20 EMA. A sell order may be placed near this resistance area by the bears.
The Daily Stoch RSI is already showing a trend reversal signal from the oversold area, which is a bullish ray of hope.
Moreover, the MACD is going to produce a bullish breakout but both the moving lines are still in negative territory.
Conclusion
However, Bitcoin Cash price action is showing a bullish trend in the near term. if bulls manage BCH above the 20 EMA, a significant increase can be expected from the current levels towards the $145 mark ahead.
Support level – $100 and $90
Resistance level – $130 and $150
Disclaimer
The views and opinions stated by the author, or any people named in this article, are for informational ideas only, and they do not establish the financial, investment, or other advice. Investing in or trading crypto assets comes with a risk of financial loss.

Andrew is a blockchain developer who developed his interest in cryptocurrencies while pursuing his post-graduation major in blockchain development. He is a keen observer of details and shares his passion for writing, along with coding. His backend knowledge about blockchain helps him give a unique perspective to his writing skills, and a reliable craft at explaining the concepts such as blockchain programming, languages and token minting. He also frequently shares technical details and performance indicators of ICOs and IDOs.


