
 Home
Home News
News

- Amid the bearish dominance the AR price took a dive. Calling bulls to support the ecosystem.
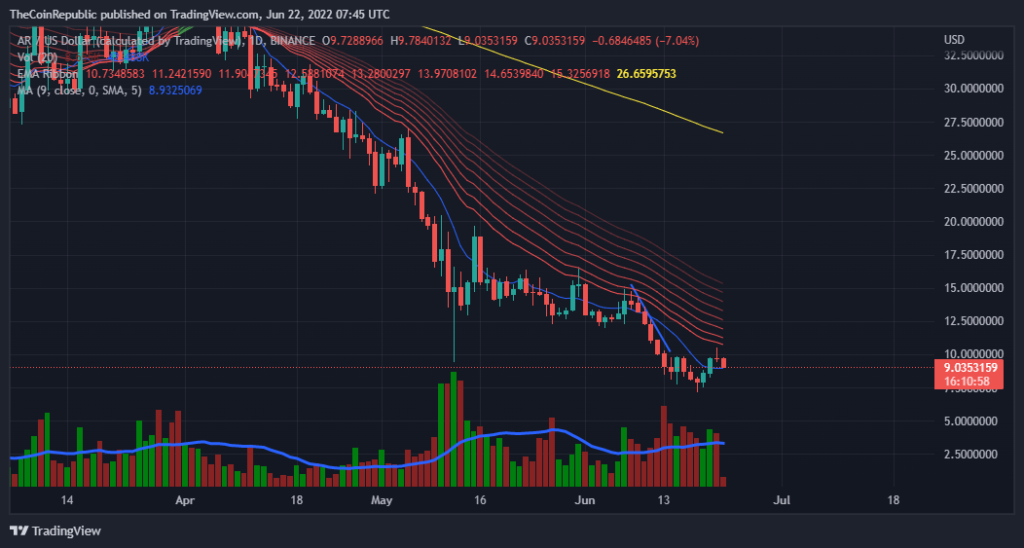
- The crypto asset is moving below the 20, 50, 100 and 200 daily moving average
- The AR/BTC pair is at 0.0004504 BTC with a loss of 5.71% in it.
After the bullish accumulation as warned by the analysts the bears scattered the bulls’ efforts and made the price drop again over the daily chart. The price fell below the support of $10 again. The bulls need to come forward to rescue the token from this bearish dominance over the market. The price slumped 9.45% in just 24 hrs, still the coin is trading above the 5 days simple moving average. If the situation continues the coin will fall below the crucial support of $7 and it will be very difficult for the AR bulls to make the coin recover. So to make the coin sustain in the market the coin needs to attract buyers for successful recovery.

The price for one AR coin is trading presently at $9.15 with a loss of 9.45% in the last 24 hrs. The coin has a trading volume of 21 million with a loss of 43.43%% in the 24 hrs trading session and a market cap of 303 million which is at a loss of 10.14% in it. The volume market cap ratio for AR is 0.06843.

Short-term Analysis
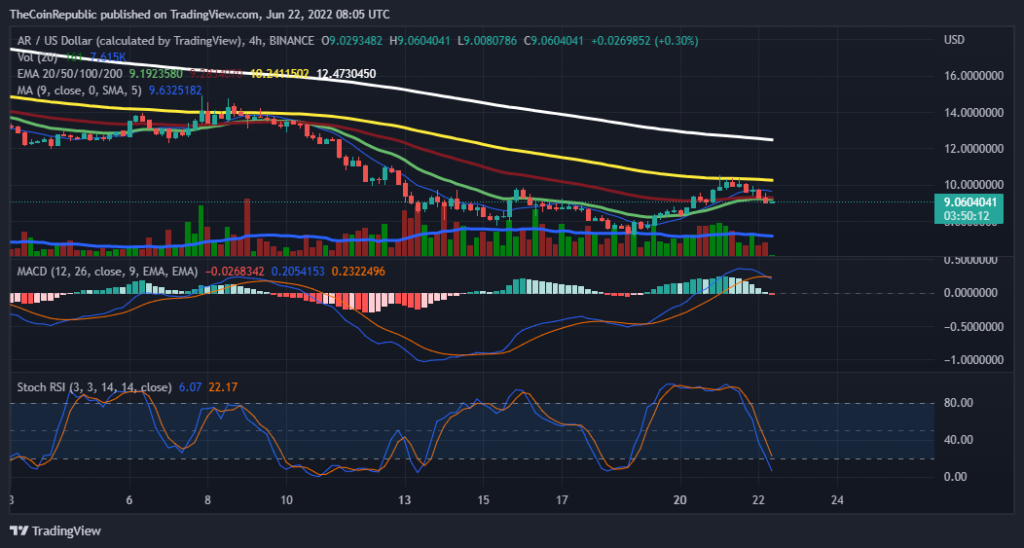
While analyzing the graph for a short term (4 hrs) we can closely observe the initiation of bearish movement over the chart. The price is moving significantly low below the moving average.
While observing the MACD indicator we can observe the negative cross over just now as the buyers are decreasing so the MACD line is going to make a cross and the MACD signal line will move above, indicating the bearish movement further.
The relative strength index in support of the above statement is taking a dive indicating the increase in selling pressure. The RSI value for AR is below 50.
Conclusion
As warned by the analysts the bears are back to the market making price drop over the daily and hourly chart. The price slumped 9.45% in just 24 hrs, still the coin is trading above the 5 days simple moving average over the daily chart. With a downtrend over the hourly graph the technical indicator suggests a bearish movement further.
Technical levels
Resistance levels: $9.8 and $10.5
Support levels: $8.3 and $7.3
Disclaimer
The views and opinions stated by the author, or any people named in this article, are for informational ideas only, and they do not establish the financial, investment, or other advice. Investing in or trading crypto assets comes with a risk of financial loss.
ALSO READ: Tron’s Stablecoin Suffers De-peg; Founder Justin Sun Claims USDD’s Collateral Has $2 billion
Steve Anderson is an Australian crypto enthusiast. He is a specialist in management and trading for over 5 years. Steve has worked as a crypto trader, he loves learning about decentralisation, understanding the true potential of the blockchain.


