
 Home
Home News
News

- Flow coin price action reversed sharply from the recent weekly bottom and is showing a V-shaped recovery in the context of the 4-hours chart.
- The FLOW token is near a short-term resistance area of $1.7 while trading in the green zone.
- The RSI indicator is looking above the semi-line on the hourly chart, moreover, its peak just above the oversold zone in the case of the daily price chart.
The Flow coin has turned to the upside since June 18, so the bulls celebrate the upward momentum and they do not want to lose control of the FLOW coin after a hard long struggle.

Meanwhile, for the last five trading sessions Flow Coin is moving higher apart from the bearish inside yesterday’s candle. Now again the bulls are dominating the trend of Flow coin, as a result, the coin is trading at the $1.58 mark as of press time.

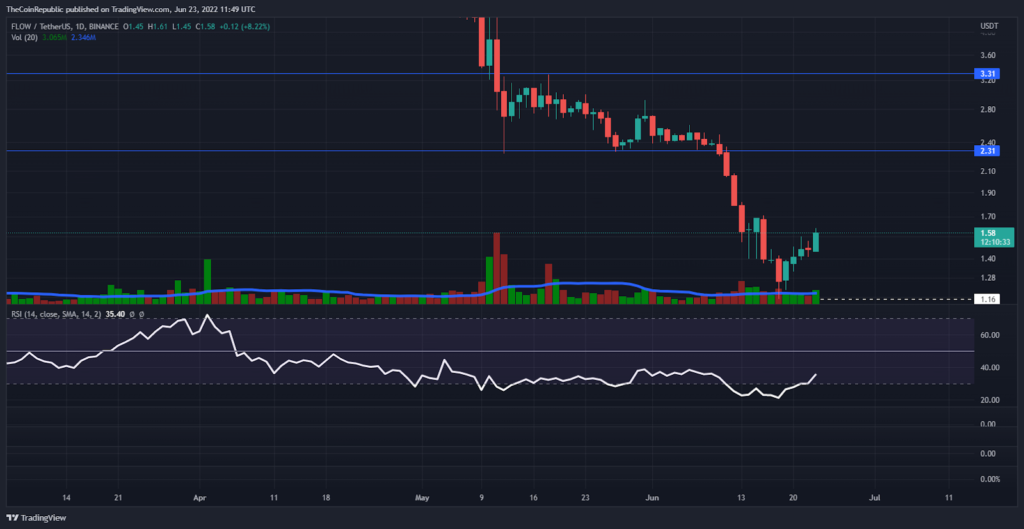
In the context of the 4-hour price chart, Flow coin noted a V-shaped recovery from the recent bottom line as well as a new 52-week low of $1.17. This critical area became an important hedge for flow investors.
While trading in the green zone, the FLOW token is near a short-term resistance zone of $1.7 before reaching the round level of $2.0. Furthermore, the market cap is up 7% to $1.6 billion in the last 24 hours.
Whereas, on the one hand, the RSI indicator looks above the half-line in the hourly chart, moreover, it is just above the oversold zone in the case of the daily price chart. However, trading volumes are looking decent for the current trends.
Lower Band of BB indicator behaves like a support zone
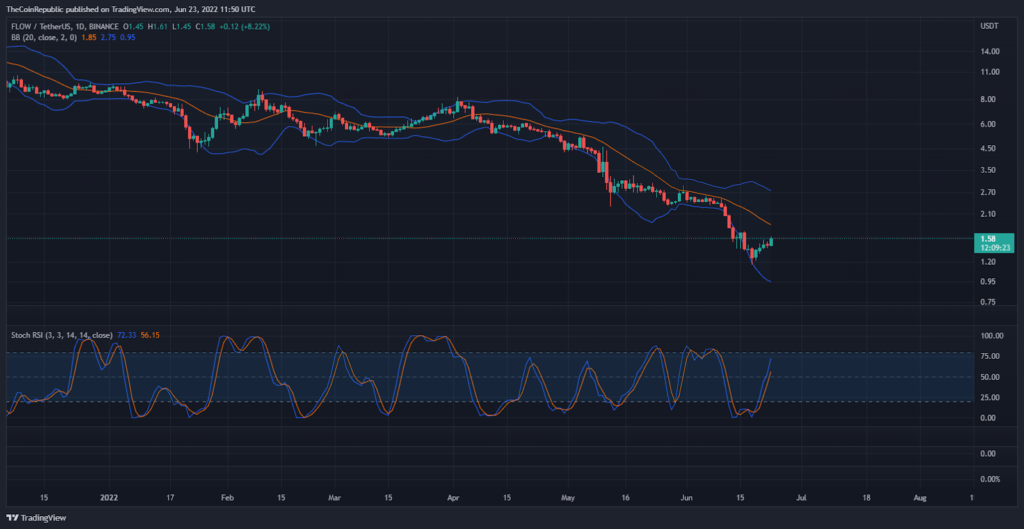
On the daily price scale, Flow Coin recovers from the lower band of the Bollinger Bands indicator and reaches its middle band (20 EMA).
Besides, the Stoch RSI is managing above the 60-mark and the Flow coin is showing bullish clues.
Conclusion
Although the Flow coin outlook is slightly bullish for the short-term target, a pullback could be seen for the bulls near the mid-band of the Bollinger Bands indicator.
Support level- $1.38 and $1.0
Resistance level- $2.0 and $3.3
Disclaimer
The views and opinions stated by the author, or any people named in this article, are for informational ideas only, and they do not establish the financial, investment, or other advice. Investing in or trading crypto assets comes with a risk of financial loss.
ALSO READ: Gorilix (SILVA) gets off to a strong start as Bitcoin (BTC) and Cardano (ADA) suffer losses.

Andrew is a blockchain developer who developed his interest in cryptocurrencies while pursuing his post-graduation major in blockchain development. He is a keen observer of details and shares his passion for writing, along with coding. His backend knowledge about blockchain helps him give a unique perspective to his writing skills, and a reliable craft at explaining the concepts such as blockchain programming, languages and token minting. He also frequently shares technical details and performance indicators of ICOs and IDOs.


