
 Home
Home News
News

- The chart is making a green move over the daily as well as hourly graph. If the bulls manage consistency, it can be a successful trend reversal.
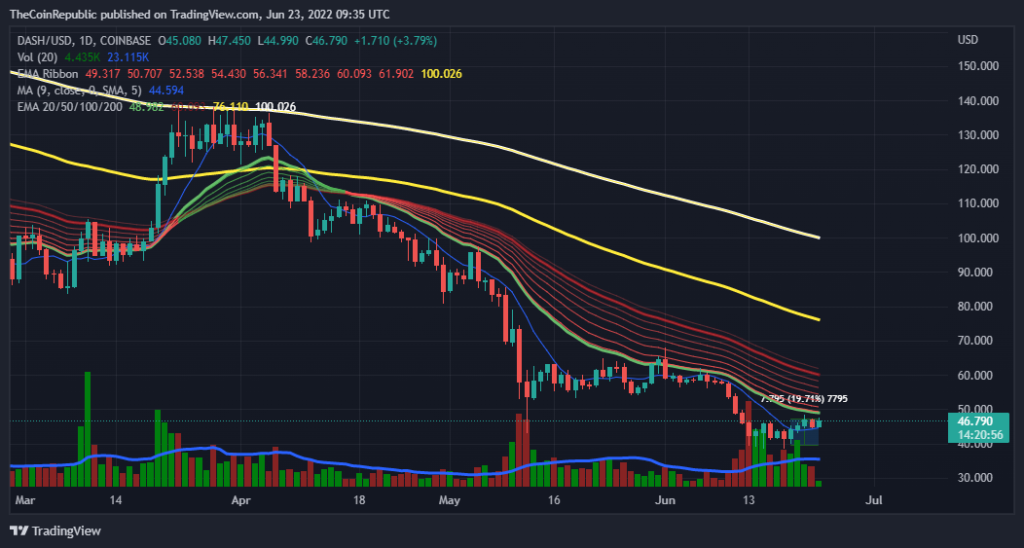
- The crypto asset is moving below the 20, 50, 100 and 200 daily moving average over the daily chart.
- The DASH/BTC pair is at 0.002248 BTC with a gain of 2.20% in it.
Dash is an open source blockchain and cryptocurrency focused on offering a fast, cheap global payments network that is decentralized in nature. According to its website, the goal of Dash is to be the most user friendly and scalable payments focused cryptocurrency in the world.

The DASH price is making a slow but a green move over the daily chart, showing the coin has managed to accumulate the bulls. The bears will definitely try to oppose the movement. The DASH price gained 19.7% in 4 days. So the bulls need to be consistent to take the price out from the mouths of bears. The bulls need to take care of the trading volume in order to make their efforts successful. The DASH price made a lower low of 45.15 USD over the intraday trading session.

Current price for one DASH stands at $47.13 with a gain of 3.31% in its market capitalization in the last 24 hrs. DASH has a trading volume of 83million acc. to CMC which is now at a loss of 8.83% in the 24 hrs trading session and a market cap of 506 million.
Short-term Analysis for DASH
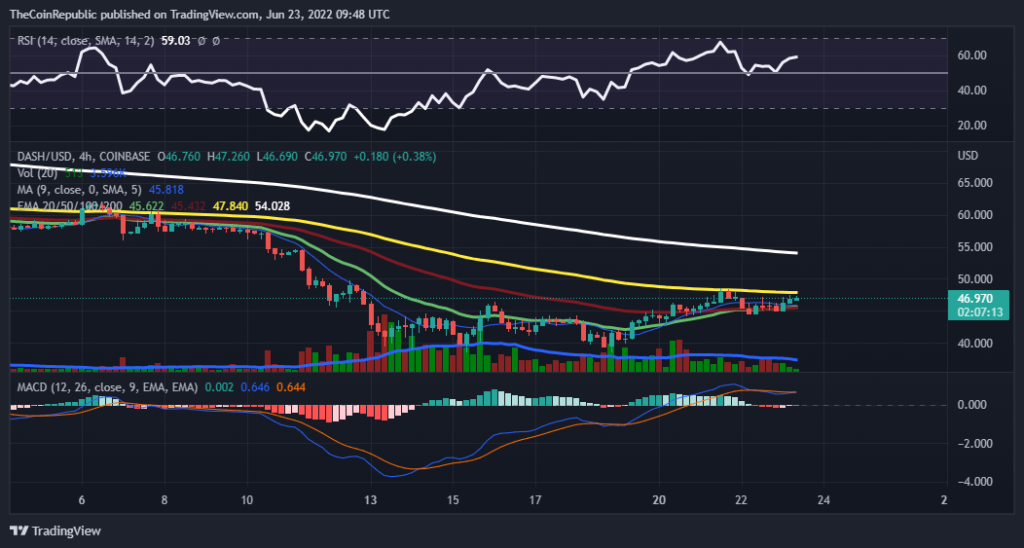
The price is trading at an overall uptrend movement over the short term (4 hrs) graph. The bulls need to take care of the trading volume as it is moving below the average volume. Analysts believe that this can be an initiation of trend reversal as the price can witness a positive cross over of multiple EMA.
In support the MACD is also at a verge of a positive cross over the MACD signal line. The histogram is appearing to be neutral currently.
The relative strength index is showing the increase in buyings, but currently moving neutrally. The RSI value for DASH is above 55.
Whereas the Bollinger band cloud is also moving neutrally.
ALSO READ – Bitcoin Is Going To Outlast All Of Us Says Michael J. Saylor
Conclusion
The DASH price is making a slow but a green move over the daily and hourly chart, showing the coin has managed to accumulate the bulls. Analysts believe that this can be an initiation of trend reversal as the price can witness a positive cross over of multiple EMA. The technical indicators are not giving any significant directional change except multiple EMA.
Technical levels
Resistance levels: $49.5 and $54.5
Support levels: $43 and $38.5
Disclaimer
The views and opinions stated by the author, or any people named in this article, are for informational ideas only, and they do not establish the financial, investment, or other advice. Investing in or trading crypto assets comes with a risk of financial loss.

Nancy J. Allen is a crypto enthusiast, with a major in macroeconomics and minor in business statistics. She believes that cryptocurrencies inspire people to be their own banks, and step aside from traditional monetary exchange systems. She is also intrigued by blockchain technology and its functioning. She frequently researches, and posts content on the top altcoins, their theoretical working principles and technical price predictions.


