
 Home
Home News
News

- ChainLink’s price is falling with a strong downtrend momentum over the daily price chart.
- The crypto asset struggled to sustain at 20 EMA and has fallen below 50, 100, and 200-days Daily Moving Average.
- The pair of LINK/BTC is at 0.0003325 BTC with an intraday drop of 4.62%.
ChainLink Price is tried to sustain at the distribution phase and has fallen from the higher level. The LINK coin is currently under the control of bears and is falling towards the accumulation phase. LINK investors must wait for any directional change over the daily price chart. The token must attract more buyers in order to avoid falling below the accumulation phase. Due to the present circumstances of the bear market, all other altcoins have also started trading bearishly as the greeted cryptocurrency6 dominator, Bitcoin struggles to sustain at the $20000 psychological level.

ChainLink’s price is presently CMP at $6.79 and has lost 8.17% of its market capitalization in the last 24-hour period. Trading volume has decreased by 19.41% in the intraday trading session. This shows that the LINK coin is under the control of bears and is facing short-selling pressure. The volume to market cap ratio is 0.1659.

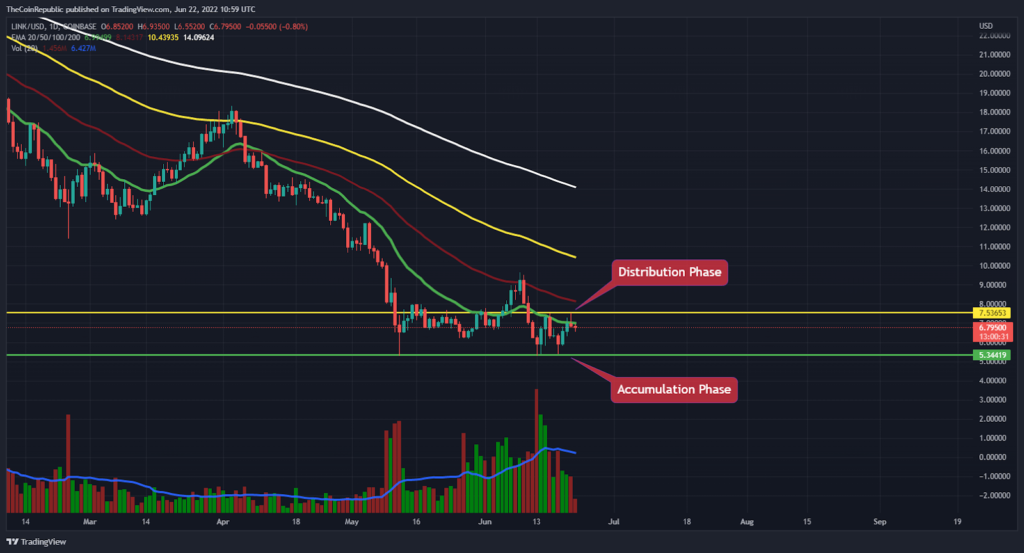
LINK coin price is trying to acquire its position inside the consolidation phase between the levels of $7.53(Distribution Level) and $5.34(Accumulation level). The token got rejected from the distribution level and couldn’t sustain resulting in a fall. LINK coin price is now trading bearishly towards the accumulation phase. It’s a matter of time to see if LINK bulls manage to gather support. Volume change can be seen below average and needs to grow for LINK to maintain its position.
Will Bulls LINK Themselves?
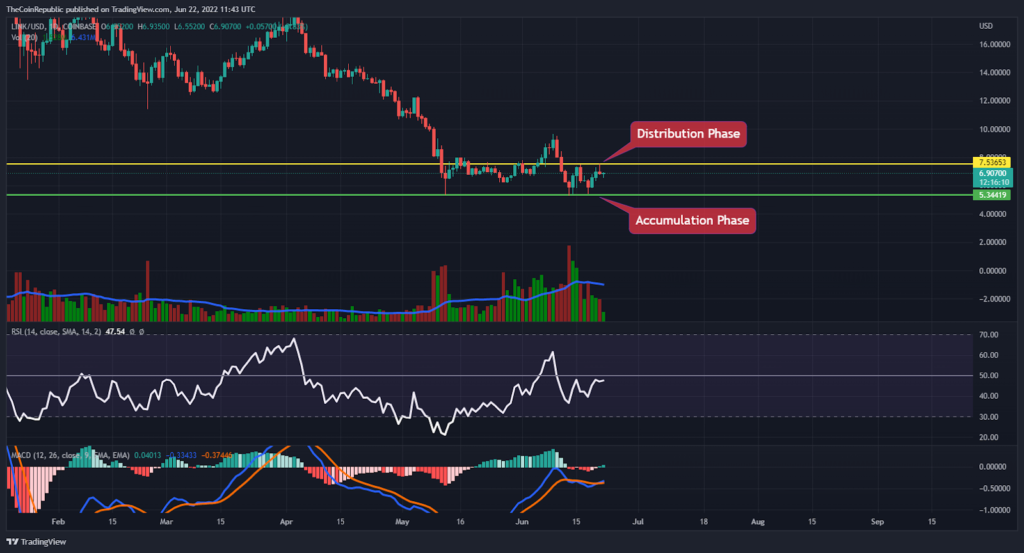
LINK coin price must accumulate more bulls in order to sustain at the current level and let the token surge over the daily price chart. Technical indicators suggest that LINK may register its breakout if bulls accumulate significantly. The relative Strength Index showcases the consolidation phase of the LINK coin. RSI is at 47 and is trying to break out of the neutrality. MACD exhibits the uptrend momentum of the LINK coin. The MACD line is ahead of the signal line after a positive crossover. LINK investors need to wait for any directional change over the daily chart.
Conclusion
ChainLink Price is tried to sustain at the distribution phase and has fallen from the higher level. The LINK coin is currently under the control of bears and is falling towards the accumulation phase. LINK investors must wait for any directional change over the daily price chart. LINK coin price is now trading bearishly towards the accumulation phase. It’s a matter of time to see if LINK bulls manage to gather support. Volume change can be seen below average and needs to grow for LINK to maintain its position. Technical indicators suggest that LINK may register its breakout if bulls accumulate significantly. LINK investors need to wait for any directional change over the daily chart.
Technical Levels
Support Levels: $5.34
Resistance Levels: $7.53
Disclaimer
The views and opinions stated by the author, or any people named in this article, are for informational ideas only, and they do not establish the financial, investment, or other advice. Investing in or trading crypto assets comes with a risk of financial loss.
ALSO READ: Meta Finally Rolls Out Meta Pay And Augmented Reality On Instagram

Andrew is a blockchain developer who developed his interest in cryptocurrencies while pursuing his post-graduation major in blockchain development. He is a keen observer of details and shares his passion for writing, along with coding. His backend knowledge about blockchain helps him give a unique perspective to his writing skills, and a reliable craft at explaining the concepts such as blockchain programming, languages and token minting. He also frequently shares technical details and performance indicators of ICOs and IDOs.


