
 Home
Home News
News

- The descending triangle pattern on the daily chart for Internet Computer Price has been broken and the token consolidates below it.
- The crypto asset is trading below the 20, 50, 100, and 200-day Daily Moving Average.
- The pair of ICP/BTC is at 0.0002712 BTC with an intraday drop of 6.70%.
On the daily chart, the price of Internet computers is attempting to gain uptrend momentum. As it has dropped below the descending triangle pattern, the coin is attempting to get support from buyers. ICP bulls must gather themselves so that ICP can increase once more. Investors in ICP must watch the chart for any directional changes. ICP is currently consolidating below the descending triangle pattern and now falters to gain support from the lower levels.

Internet Computer’s price is presently CMP at $5.49 and has lost 10.57% of its market capitalization in the last 24-hour period. However, trading volume has increased by 24% in the intraday trading session. This shows that buyers are still present for the rescue of the ICP coins. However, the rate of accumulation is low and must be increased during the intraday trading session. The volume to market cap ratio is 0.07964.

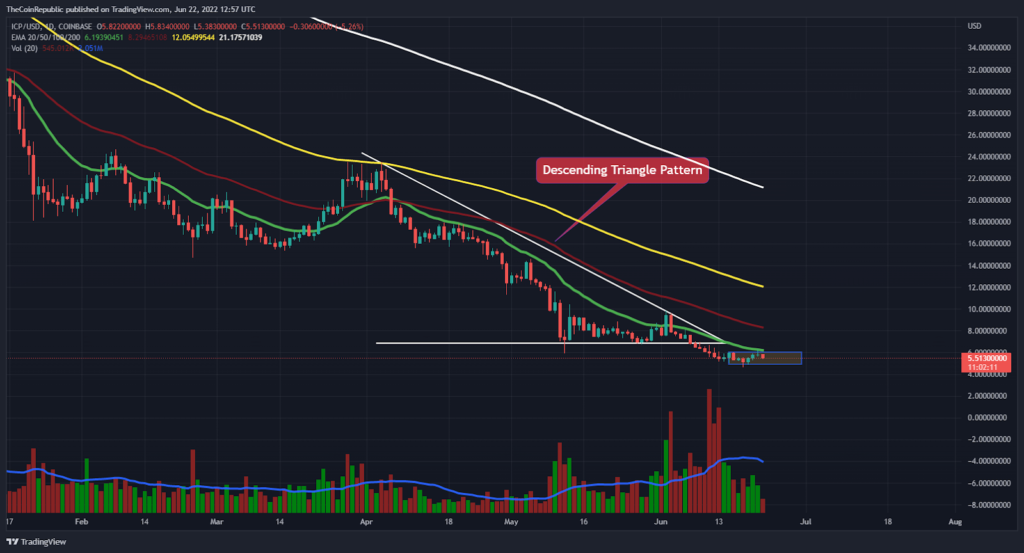
ICP coin price is attempting to attract more buyers in order to break through the falling triangle’s lower trendline. The volume change, which is seen below the average line, must increase for ICP to soar over the chart. Volume bars that are gradually falling indicate that ICP is imprisoned inside a declining triangular pattern. ICP bulls must step up to organize the token’s rescue and let it soar over the daily chart.
What do Technical Indicators Suggest about ICP?
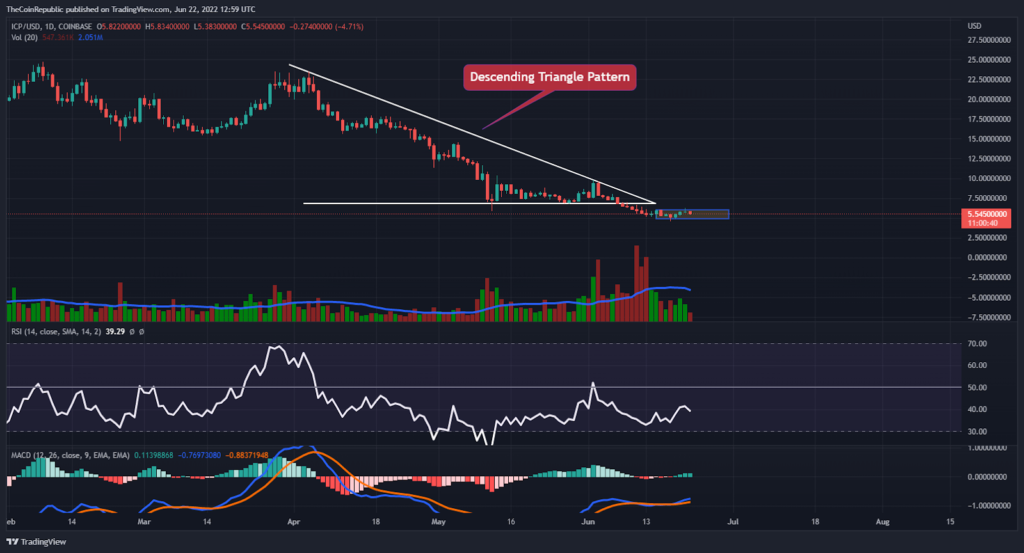
The price of ICP currency initially formed a descending triangle formation, and it is currently trading below that pattern with a significant downtrend momentum. Technical indicators point to the ICP coin’s momentum being bearish. ICP is trading in the oversold region, according to the Relative Strength Index. Investors in ICP can anticipate any directional movement as soon as the RSI drops below 30 while it is at 35. The ICP coin’s downward velocity is visible in MACD. For a negative crossing, the MACD line is getting close to the signal line. This means that for a few trading sessions, ICP might be subject to intense selling pressure.
Conclusion
On the daily chart, the price of Internet computers is attempting to gain uptrend momentum. As it has dropped below the descending triangle pattern, the coin is attempting to get support from buyers. ICP bulls must gather themselves so that ICP can increase once more. Volume bars that are gradually falling indicate that ICP is imprisoned inside a declining triangular pattern. ICP bulls must step up to organize the token’s rescue and let it soar over the daily chart. Technical indicators point to the ICP coin’s momentum being bearish. For a negative crossing, the MACD line is getting close to the signal line. This means that for a few trading sessions, ICP might be subject to intense selling pressure.
Technical Levels
Support Levels: $4.90 and %5.00
Resistance Levels: $6.00 and $6.80
Disclaimer
The views and opinions stated by the author, or any people named in this article, are for informational ideas only, and they do not establish the financial, investment, or other advice. Investing in or trading crypto assets comes with a risk of financial loss.
ALSO READ: Cardano Founder- Hoskinson On Regulating US Cryptos

With a background in journalism, Ritika Sharma has worked with many reputed media firms focusing on general news such as politics and crime. She joined The Coin Republic as a reporter for crypto, and found a great passion for cryptocurrency, Web3, NFTs and other digital assets. She spends a lot of time researching and delving deeper into these concepts around the clock, and is a strong advocate for women in STEM.


