
 Home
Home News
News

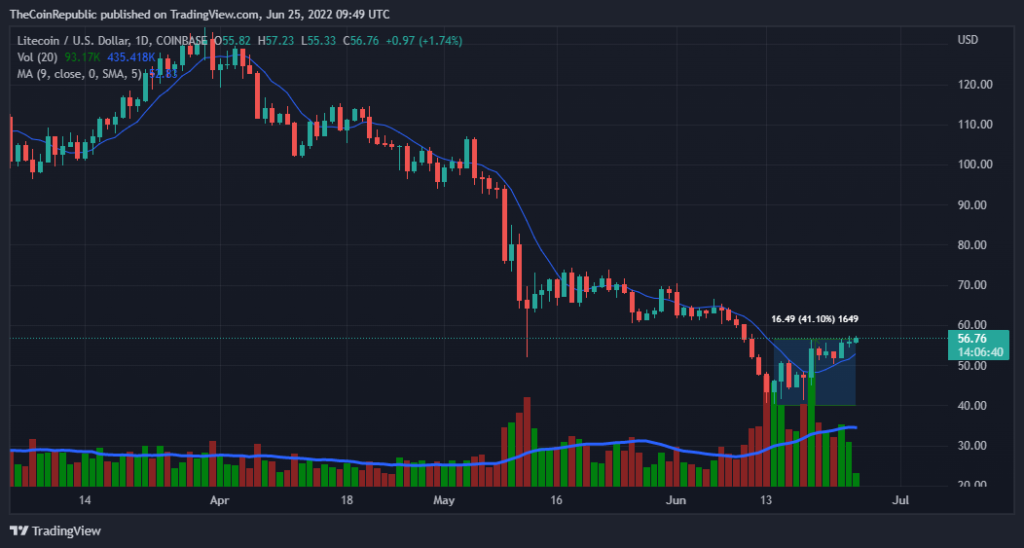
- The LTC price is at a flattering uptrend movement over the daily chart. Investors should wait till the signal gets strong.
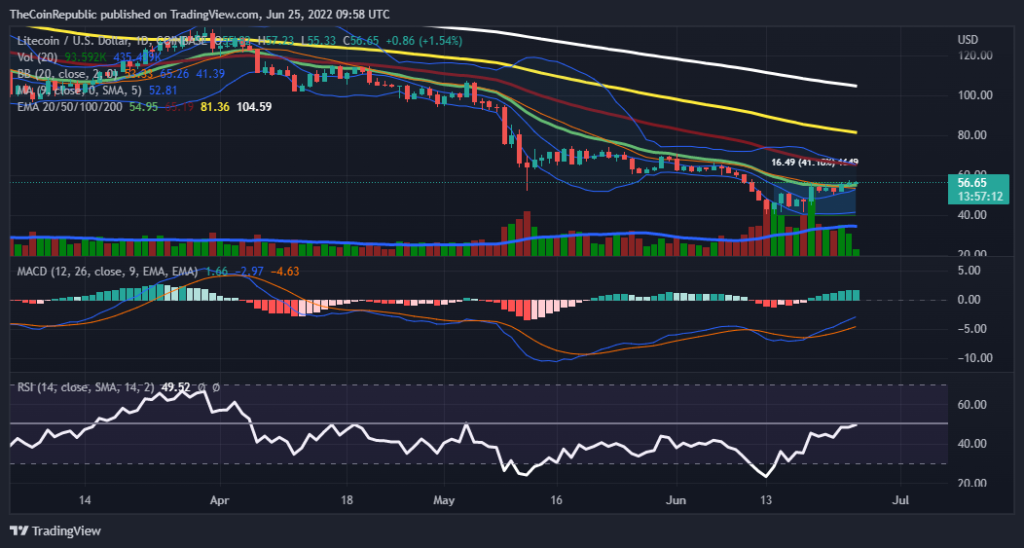
- The crypto asset is moving above the 20, 50, 100, and 200 daily moving average over the daily graph.
- The LTC/BTC pair is at 0.002649 BTC with a loss of 0.16% in it.
While talking about LTC we can observe a flattering uptrend after a bearish dominance over the daily chart. This signifies the bearish dominance is ending and the LTC bulls are trying to take over the market. The volume is still at a loss of 7% in the last 24 hrs session. The LTC price made a lower low of $24.88 over the intraday trading session. The investors can wait till the bulls make a pump over the volume which will support the uptrend movement of the price. The price surged 41% in 12 days which can be a sign of relief for the LTC investors and the price is moving significantly above the exponential moving average.

The current price for one LTC is trading at $56.86 with a gain of 2.41% in its market cap in the last 24 hrs. The coin has a trading volume of 558 million which is at a loss of 7.83% in the 24 hrs trading session and a market cap of 4 billion. The volume market cap ratio for LTC is at 0.1392.

What do Technical Indicators Suggest for LTC
The volume is trading quite low below its average, as volume has a crucial role in regulating the price so the buyers must take care of it.
The other technical indicators like MACD indicate a bullish rally ahead as the MACD line is moving above the MACD signal line with the gap between the two gettings broader. On the other, the Bollinger band cloud is moving neutrally.
The relative strength index is showing an increase in buyings and continuously moves to the upward region. The RSI value is nearly equal to 50.
The price is moving significantly above the 5-day simple moving average.
Conclusion
While talking about LTC we can observe a flattering uptrend after a bearish dominance over the daily chart. The volume is still at a loss of 7% in the last 24 hrs session the investors can wait till the bulls make a pump over the volume. Whereas the technical indicators suggest a bullish rally ahead, which will attract the buyers.
Technical levels
Resistance levels: $60 and $66.3
Support levels: $50 and $41.5
Disclaimer
The views and opinions stated by the author, or any people named in this article, are for informational ideas only, and they do not establish the financial, investment, or other advice. Investing in or trading crypto assets comes with a risk of financial loss.
ALSO READ: Eminem And Snoop Dogg Brings BAYC Into Their Latest Music Hit

Nancy J. Allen is a crypto enthusiast, with a major in macroeconomics and minor in business statistics. She believes that cryptocurrencies inspire people to be their own banks, and step aside from traditional monetary exchange systems. She is also intrigued by blockchain technology and its functioning. She frequently researches, and posts content on the top altcoins, their theoretical working principles and technical price predictions.


