
 Home
Home News
News

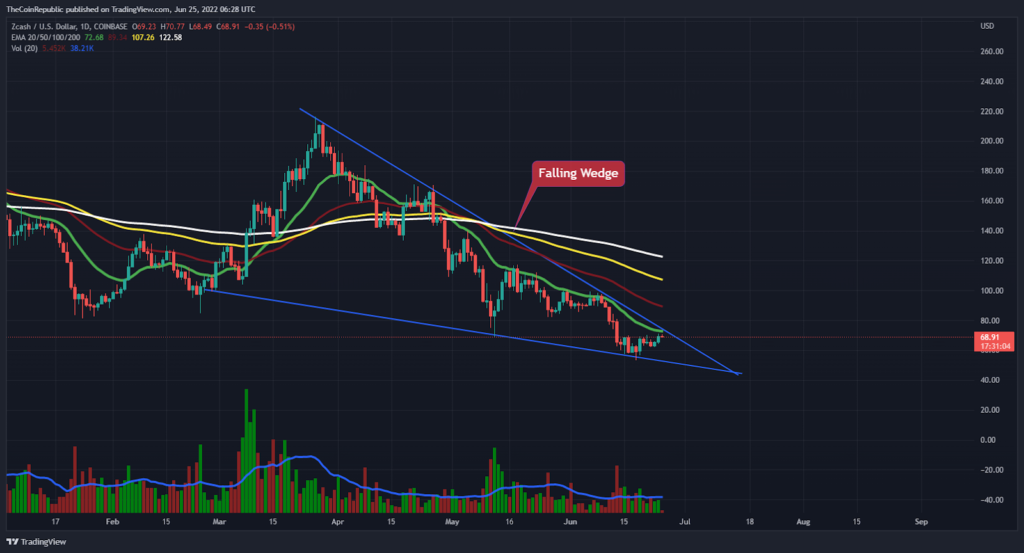
- Zcash price is surging towards the upper trendline of falling wedge pattern over the daily price chart.
- The crypto asset is recovering towards 20 EMA and aims for 50, 100 and 200-days Daily Moving Average.
- The pair of ZEC/BTC is at 0.003268 BTC with an intraday gain of 5.85%.
Zcash price is trying to escape the falling wedge pattern over the daily price chart. The token is preparing to sustain itself at the verge of the falling wedge pattern. ZEC bulls must sustain at the upper trendline to register the breakout of ZEC coin from the falling pattern. However, volume seems pretty low and needs to be increased in the intraday trading session to let ZEC surge out of the falling wedge pattern. The tone needs to attract more buyers in order to escalate itself outside.

Zcash price is presently CMP at $68 and has gained around 7.84% of its market capitalization in the last 24-hour period. Trading volume has increased by 2.44% in the intraday trading session. This signifies that ZEC is trying to attract buyers in order to escape the pattern but accumulation needs to be increased. Volume to market cap ratio is 0.0906.

ZEC coin price is preparing for its breakout from the falling parallels channel over the daily price chart. ZEC coin is aiming to gather more buyers in order to exit the consolidation phase on the daily price chart. Between $0.32 and $0.60, the token has been regaining ground. ZEC has to develop bulls in order to exit the consolidation phase. The volume change is lower than usual, though, and must rise in order for ZEC to go on to the consolidation stage. The token must accumulate force of bulls to register its breakout. However, volume change can be seen below average and needs to grow for ZEC to successfully escape the pattern.
ZEC Bulls Sustain or get Detained?
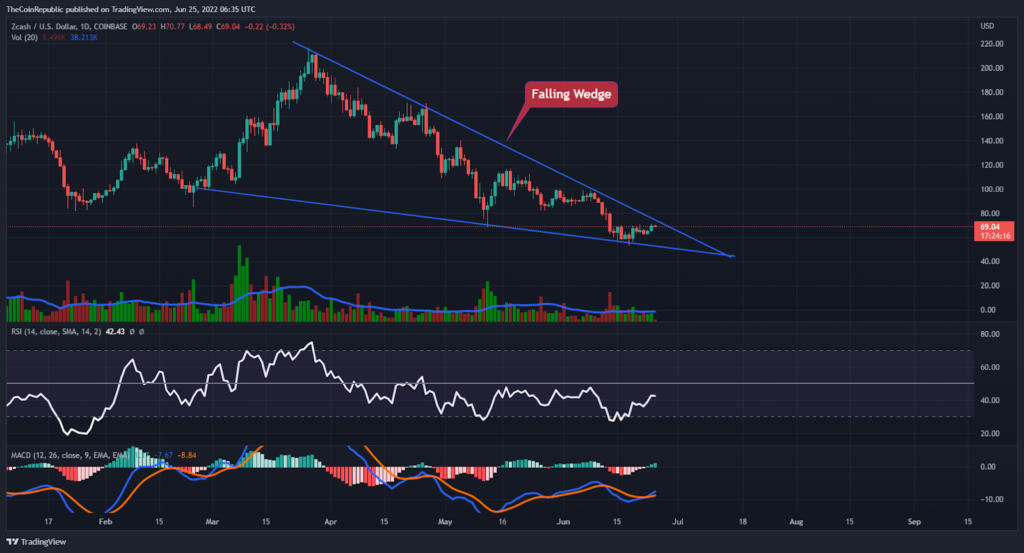
In order to break out of the declining pattern, ZEC coin price needs to attract more buyers. The volume change, however, indicates that volume should be raised in favor of bulls. Technical indicators suggest the uptrend momentum of ZEC coin. Relative Strength Index showcases the uptrend momentum of ZEC coin. RSI is at 42 and is below the neutrality, it must break out of neutrality to surge over the daily price chart.
MACD exhibits the bullish momentum of the ZEC coin. The MACD line is ahead of the signal line after a positive crossover.
Conclusion
Zcash price is trying to escape the falling wedge pattern over the daily price chart. The token is preparing to sustain itself at the verge of the falling wedge pattern. ZEC bulls must sustain at the upper trendline to register the breakout of ZEC coin from the falling pattern. The volume change is lower than usual, though, and must rise in order for ZEC to go on to the consolidation stage. The token must accumulate force of bulls to register its breakout. However, volume change can be seen below average and needs to grow for ZEC to successfully escape the pattern. Technical indicators suggest the uptrend momentum of ZEC coin.
Technical Levels
Support Levels: $55.00
Resistance Levels: $75.00
Disclaimer
The views and opinions stated by the author, or any people named in this article, are for informational ideas only, and they do not establish the financial, investment, or other advice. Investing in or trading crypto assets comes with a risk of financial loss.

Andrew is a blockchain developer who developed his interest in cryptocurrencies while pursuing his post-graduation major in blockchain development. He is a keen observer of details and shares his passion for writing, along with coding. His backend knowledge about blockchain helps him give a unique perspective to his writing skills, and a reliable craft at explaining the concepts such as blockchain programming, languages and token minting. He also frequently shares technical details and performance indicators of ICOs and IDOs.


