
 Home
Home News
News

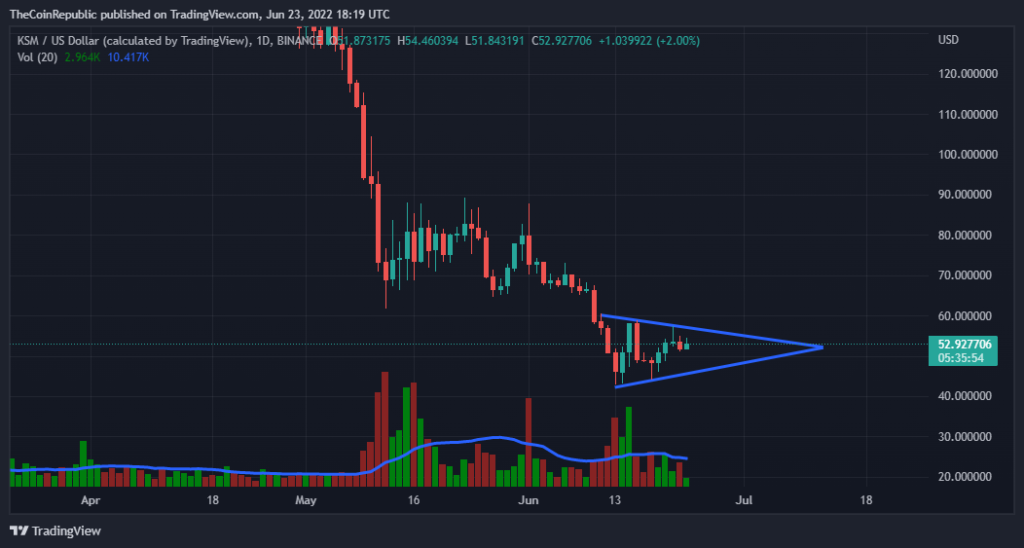
- The KSM price appears to fall in a falling wedge pattern over the daily and hourly chart. The coin strictly needs its bulls to make a breakout.
- The crypto asset is moving below the 20, 50, 100, and 200 daily moving average.
- The KSM/BTC pair is at 0.002596 BTC with a gain of 1.06% in it.
Kusama is unusual among blockchain platforms since it is predominantly built for developers that want to launch bold, ambitious projects, with a fast-evolving pace of development.

The KSM price after a downtrend now appears to enter a falling wedge pattern over the daily chart. Analysts believe that if the price made a successful breakout the price may hit the resistance of $60 or $65. The coin needs to attract more buyers to make a successful breakout and if the reverse happens the price drop may lead to support of $40. Then it will be a tough situation for the bulls to make the coin recover. The coin strictly needs recovery to prevent a collapse and sustain in the market.

The current price for one KSM coin is trading at $53.05 with a loss of 0.06% in its market capitalization in the last 24 hrs. The coin has a trading volume of 30 million with a loss of 8.67% in the 24 hrs trading session and a market cap of 447 million which is a loss of 0.57% in it. The volume market cap ratio is 0.06786.
Short-term Analysis for KSM
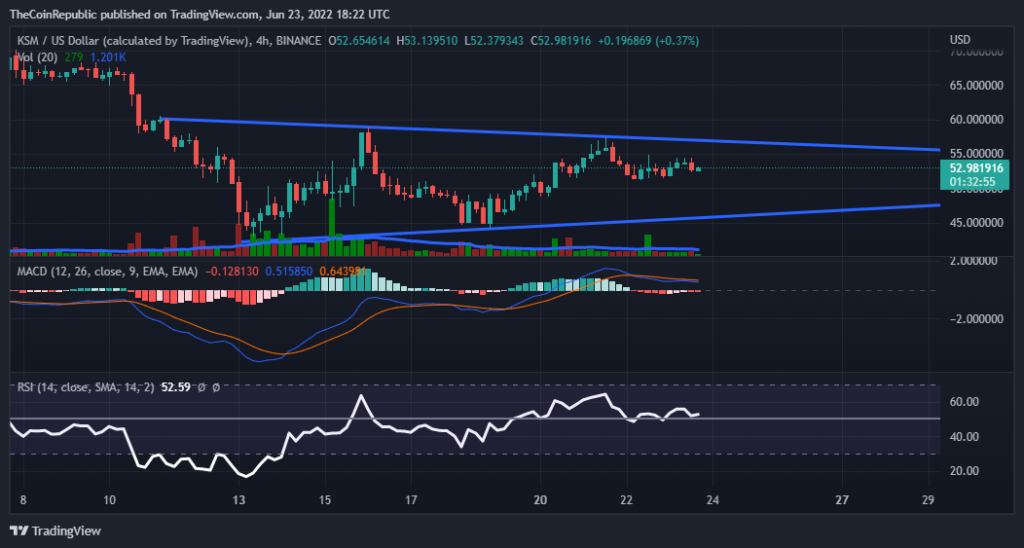
The graph for the short term closely shows how the price is stuck in a falling wedge pattern. The coin strongly needs the support of bulls to make a breakout and it is strictly needed for the KSM ecosystem. Technical indicators appear to be of little help as we can see the MACD indicator is giving some frequent crossovers so no final movement can be predicted here.
In support of the above, the relative strength index is also moving neutrally indicating the equity between buyers and sellers. The RSI value for KSM is currently below 55.
Conclusion
The KSM price after a downtrend now appears to enter a falling wedge pattern over the daily and hourly chart. The coin strongly needs the support of bulls to make a breakout and it is strictly needed for the KSM ecosystem. The short-term analysis shows the same. The technical indicators appear to be of little help as no directional change can be predicted from them.
Technical levels
Resistance levels: $54.4 and $56.5
Support levels: $51.5 and $48.7
Disclaimer
The views and opinions stated by the author, or any people named in this article, are for informational ideas only, and they do not establish the financial, investment, or other advice. Investing in or trading crypto assets comes with a risk of financial loss.
ALSO READ: Robinhood Receives 600 Million DOGE From Wallets Marked Anonymous

Nancy J. Allen is a crypto enthusiast, with a major in macroeconomics and minor in business statistics. She believes that cryptocurrencies inspire people to be their own banks, and step aside from traditional monetary exchange systems. She is also intrigued by blockchain technology and its functioning. She frequently researches, and posts content on the top altcoins, their theoretical working principles and technical price predictions.


