
 Home
Home News
News

The entire financial industry is based on profit and loss. Although these gains and losses are two sides of the same coin, the situations are completely different.

Everyone knows about profit when an asset gives more return than its cost. On the other hand, loss creates trouble for any retail or big investor in any financial industry either crypto or stock market.

In the crypto world, everyone wants to make money but sometimes they exceed their limits and face big losses in any crash or correction.
Sometimes several big bulls/whales fail to spot crashes and corrections in a downtrend. Here are the differences between a crypto crash and a correction.
What defines a crypto crash?
According to traditional finance terms, a crash occurs when a crypto asset falls by more than 10% on the same day.
These occur when some big news suddenly spreads in the market and investors start reducing their investments in view of the panic situation.
Many fundamental analysts give indications of impending crashes before it happen but chart visualization is the best way to define panic conditions and it is easy for everyone to understand.
From a technical point of view, panic selling begins when uncertainty increases and any panic situation occurs, such as the COVID-19 pandemic. We can better understand how investors view a massive sell-off by looking at the bitcoin price graph below.
26-feb,2020-Bitcoin price chart
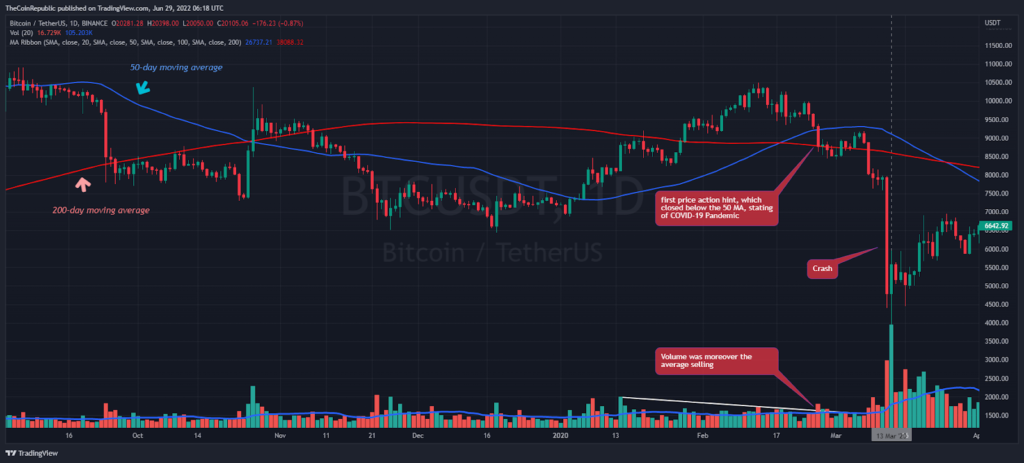
In the context of a crash, the price turns lower and there is a sudden jump in trading volume and above the average selling level. As well as when the price closes below the 50-day moving average or 200-day moving average.
According to Bitcoin’s daily price chart, investors saw a sell signal on February 26, 2020, as the daily price closed below the 50-day moving average with above-average selling volume. This shows that the big whales began to reduce their investments and were afraid of holding assets in their portfolios.
The infamous “Black Thursday” crash occurred on March 12, 2020, as indicated by the large red candlestick depicted as a crash on the chart. Even at excessive levels, the price fell nearly 40% after the World Health Organization declared the coronavirus a global pandemic, from $7,969.90 to $4,776.59.
Trading volume is the most effective way to detect any hidden movements. Following the March 12, 2020 crash, buyers became more aggressive on March 13, 2020, as measured by trading volume, which was the highest in the previous three years.
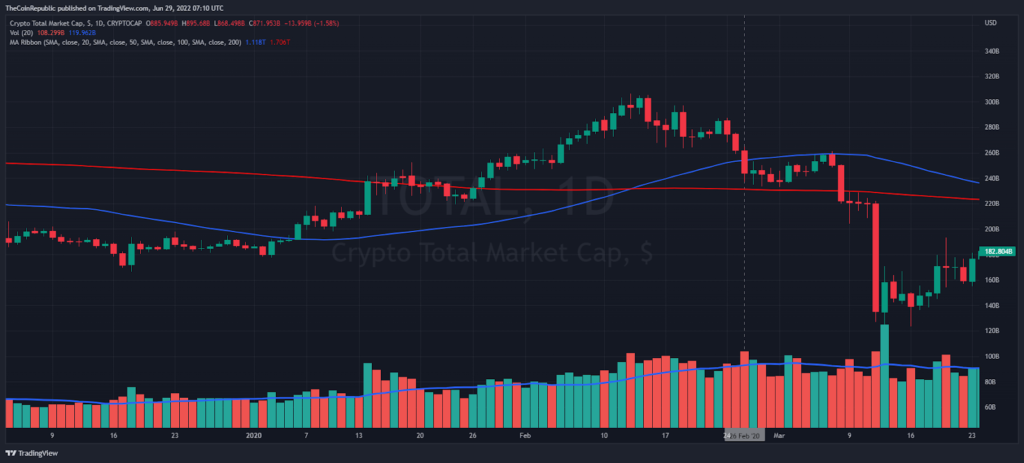
At the same time on 26 February 2020 the crypto total market cap closed below the 50 day moving average (above chart) prior to the crash. It shows any price below the 50-day SMA or 200-day SMA, which is a sign of heavy selling.
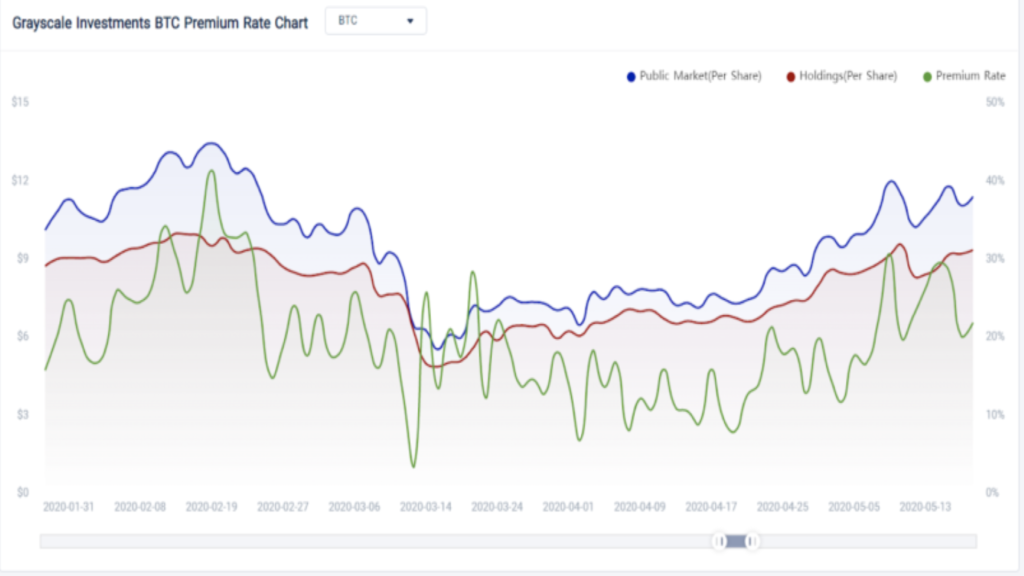
According to Tokenview, prior to the Covid-19 news flow, the Grayscale Investments BTC premium rate was starting to decline and was indicating an upcoming bloodbath for the crypto assets.
These few factors indicate a signal of any Crash in the context of technical price analysis.
What defines correction?
A correction is defined by a gradual decline in which the price falls by more than 10% over the course of several days, but the bulls are present to manage the decline.
Bullish traders are usually exhausted and require time to consolidate and recover. Exhaustion happens when the majority of buyers have purchased the underlying asset and no new buyers are seeking to support the uptrend.
A correction usually occurs when an asset is in a bullish trend and has been performing well for several days. During an uptrend the bulls need to book their profit and the bears have to take advantage at the same time in case of price correction,
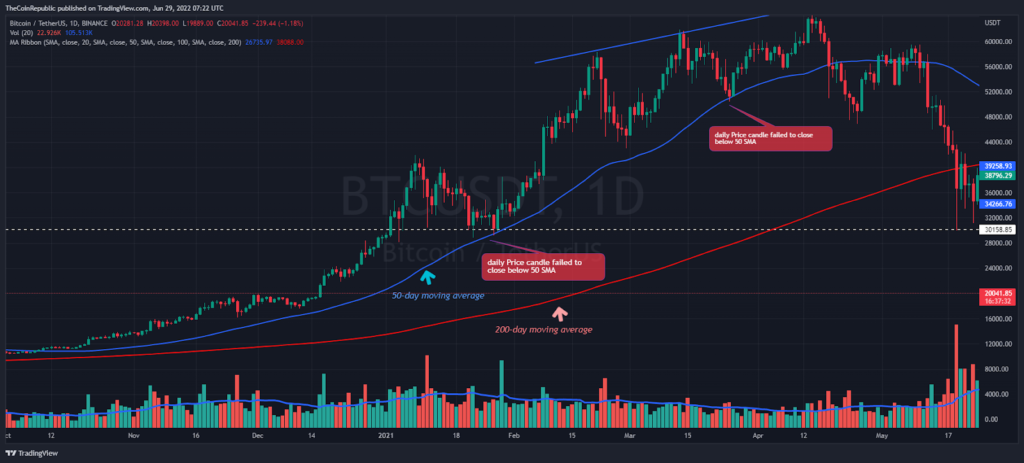
According to the bitcoin daily price chart (above), when Bitcoin was in a strong bullish trend and the daily price was above the 50-day moving average (blue). In the correction phase, buyers follow a buying on dip technique and try to buy each minor drop. Near the 50-SMA, the bulls had placed their buy orders, with each correction turning into a bullish opportunity as a result. Moreover, the trading volume also shows aggressive buying during the retesting of the 50-SMA.
Hidden Technical divergence that you should know
Speculators also get trapped during the divergence. Below the Bitcoin price chart, we can spot the bearish divergence and hidden technical signals.
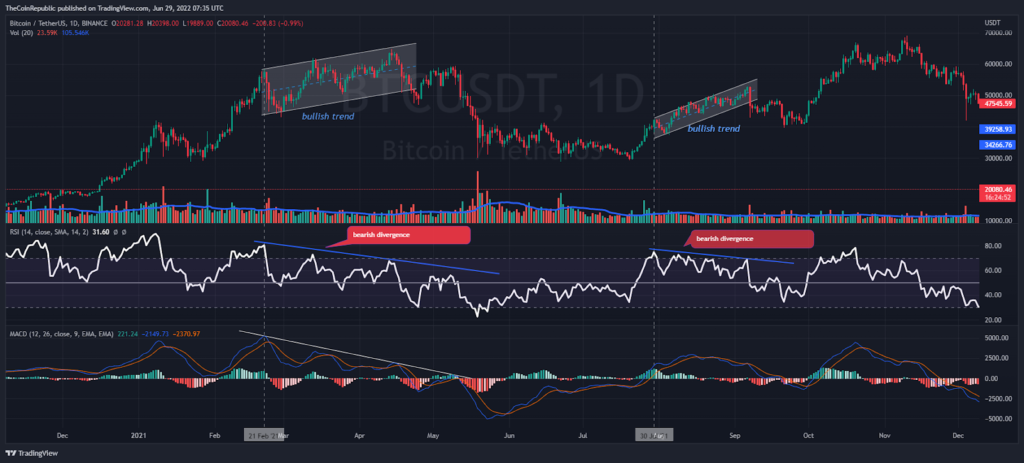
From the end of February to the end of April in 2021, the technical term was completely different. Meanwhile, the price action followed a bullish trend (in the parallel chart), on the other hand, technical indicators like RSI and MACD continued to move lower, this is called bearish divergence.
Now the question raise; how to deal with uncertain circumstances?
No one can predict future trends accurately in any Financial market. What you need to learn is to manage your money while investing and trading. During these market crashes many retail and institutional investors have been liquidated, So avoid being a part of such ill fated instances.

Nancy J. Allen is a crypto enthusiast, with a major in macroeconomics and minor in business statistics. She believes that cryptocurrencies inspire people to be their own banks, and step aside from traditional monetary exchange systems. She is also intrigued by blockchain technology and its functioning. She frequently researches, and posts content on the top altcoins, their theoretical working principles and technical price predictions.


