
 Home
Home News
News

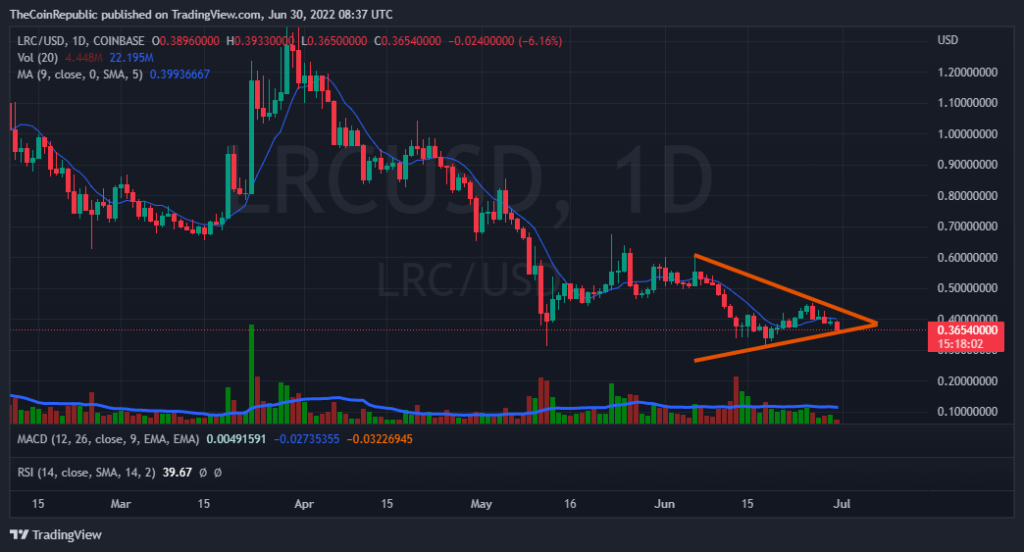
- The flattering downtrend has entered in a symmetrical triangle pattern over the daily chart.
- The crypto asset is moving below the 20, 50, 100 and 200 daily moving average.
- The LRC/BTC pair is at 0.00001897 BTC with a loss of 2.25% in it.
LRC is the Ethereum-based cryptocurrency token of loopring, an open protocol designed for the building of decentralized crypto exchanges. Loopring’s purported goal is to combine centralized order matching with decentralized on-blockchain order settlement into a hybridized product that will take the best aspects of both centralized and decentralized exchanges.

The LRC price amid bearish pressure has entered in a symmetrical triangle pattern over the daily chart. This signifies that the bulls are being recessive here so the token needs to attract buyers in order to make a successful breakout here. But the bears getting over powered here will try to make a breakout and the token price may slumps to the crucial support of $0.20. The LRC price is currently moving below the exponential moving average.

The price for one LRC token is currently moving at $0.36 with a loss of 5.84% in its market capitalization in the last 24 hrs. The coin has a trading volume of 69 million which is currently at a gain of 12.12% in the 24 hrs trading session and a market cap of 488 million. The volume market cap ratio is 0.1423.
What do Technical Indicators suggest for LRC?
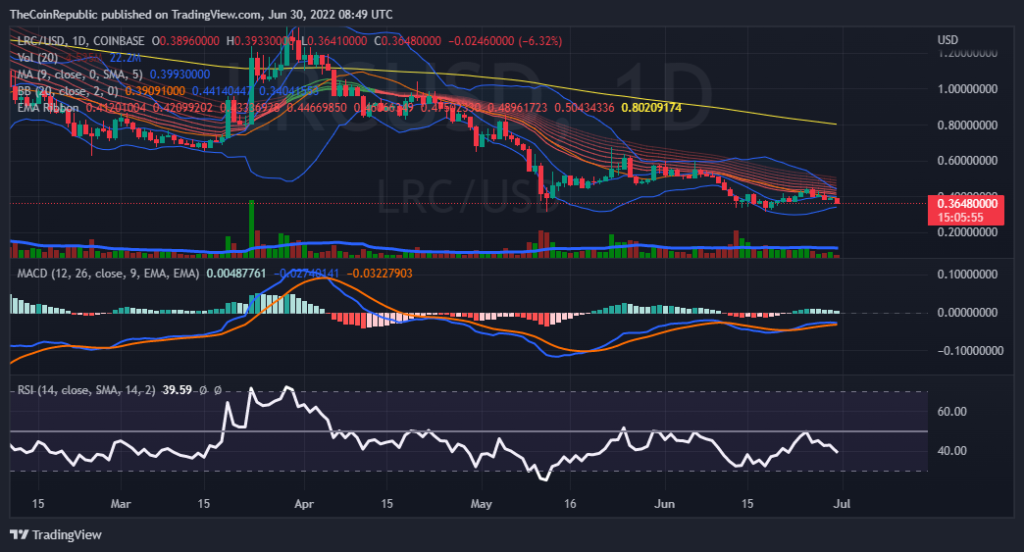
While talking about the indicators we can see the Bollinger band cloud is moving neutrally not indicating any directional move. Whereas the trading volume is still moving below its average.
On the other hand, the MACD indicator histograms are shrinking and the MACD line is going to make a negative cross over the MACD signal line indicating a bearish rally ahead.
The relative strength index is also supported by showing the increase in selling pressure over the LRC token. The RSI value for LRC is currently below 40.
Conclusion
The LRC price amid bearish pressure has entered a symmetrical triangle pattern over the daily chart while a strong downtrend can be observed over the hourly chart. To register a successful breakout the token needs to attract buyers, but the bears here will definitely interrupt and try to make a breakdown. The technical indicators appear to be in favor of bears this time.
Technical levels
Resistance levels: $0.45 and $0.51
Support levels: $0.31 and $0.26
Disclaimer
The views and opinions stated by the author, or any people named in this article, are for informational ideas only, and they do not establish the financial, investment, or other advice. Investing in or trading crypto assets comes with a risk of financial loss.
ALSO READ: Cypherpunk Holdings Let Go Of All Ethereum And Bitcoin Holdings Amid Crypto Havoc

Nancy J. Allen is a crypto enthusiast, with a major in macroeconomics and minor in business statistics. She believes that cryptocurrencies inspire people to be their own banks, and step aside from traditional monetary exchange systems. She is also intrigued by blockchain technology and its functioning. She frequently researches, and posts content on the top altcoins, their theoretical working principles and technical price predictions.


