
 Home
Home News
News

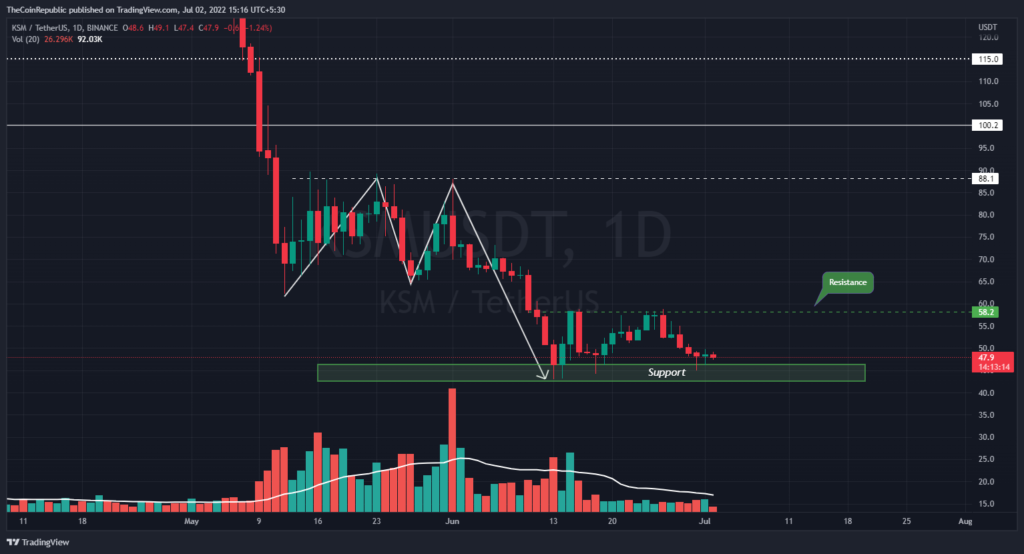
- After the retracement phase on the daily price scale, the Kusama coin trades just above the buyers’ hedge zone.
- Kusma Coin is looking below the red moving lines of the EMA Ribbon Indicator.
- The support area is still valid as the bears have made several attempts to break this area.
The Kusama coin fell dramatically in early June and marked the latest 2022 low of $43 on 13 June. Near this bull hedge zone, the bears have failed to retest several times. As of now, buyers barely manage to manage this support zone.

Despite the sell-off, the Kusama coin is trading in a horizontal range, where buyers are defending against the $43 to $46 area, while the $58 to $60 area is a short-term resistance area.

The Kusama coin is down 8.5% this week against the USDT pair. Meanwhile, at the time of writing, the KSM token was trading at the $48 mark.
Kusma investors again struggle with the retracement phase in the intraday trading session. Meanwhile, as per CMC data, the market is seeing above $400 million as of the last 24 hours.
Kusama’s price is just above the support level. Thus, price action on the Kussman coin and bitcoin pair is trading at 0.002509 satoshis, which is slightly up by 1.7%. Amid retesting support levels, the trading volume appears to be low, which seems to be moving sideways for the week.
KSM again fell below the $50 Mark
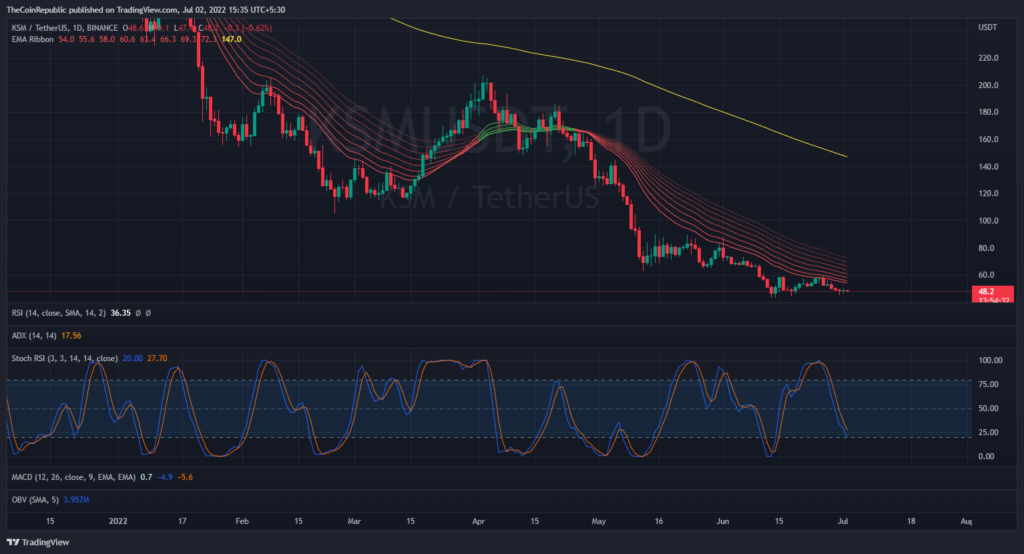
Kusma Coin is looking below the red moving lines of the EMA Ribbon Indicator. Besides, the 200 EMA of the following indicators was in the red zone of volatility.
The Stoch RSI indicator is trending lower on the daily price scale after reversing from the overbought zone. The Stoch RSI indicator is showing uncertainty for the Kusama coin.
Conclusion
Important technical indicators indicate uncertainty for the Kusma coin. However, KSM price remains in the range-bound phase and bulls need to push altcoin price above the horizontal range.
Support level – $45 and $40
Resistance level – $60 and $100
Disclaimer
The views and opinions stated by the author, or any people named in this article, are for informational ideas only, and they do not establish the financial, investment, or other advice. Investing in or trading crypto assets comes with a risk of financial loss.
ALSO READ: Babel Finance Is Hiring US Investment Bank Houlihan Lokey After Announcing Withdrawals Halt

Nancy J. Allen is a crypto enthusiast, with a major in macroeconomics and minor in business statistics. She believes that cryptocurrencies inspire people to be their own banks, and step aside from traditional monetary exchange systems. She is also intrigued by blockchain technology and its functioning. She frequently researches, and posts content on the top altcoins, their theoretical working principles and technical price predictions.


