
 Home
Home News
News

- Quant price is declining through a descending triangle pattern over the daily price chart.
- QNT crypto has fallen below the 20, 50, 100 and 200-days Daily Moving Average.
- The pair of QNT/BTC is at 0.002879 BTC with an intraday gain of 0.99.
Quant price has been falling through a descending triangle pattern over the daily price chart. The token falters to gain uptrend momentum and sustain out of the descending triangle pattern. QNT coin must accumulate buyers in order to escape the descending triangle pattern over the daily price chart. QNT investors need to wait for any directional change over the daily price chart. Quant price is currently in the make-or-break situation now bulls need to accumulate to make it out of the descending pattern.

Quant price is presently CMP at $54 and has lost 0.33% of its market capitalization in the last 24-hour period. Trading volume has decreased by 9% in the intraday trading session. This shows that bears are trying to pull the token for a breakdown in price. Volume to market cap ratio is 0.03394.

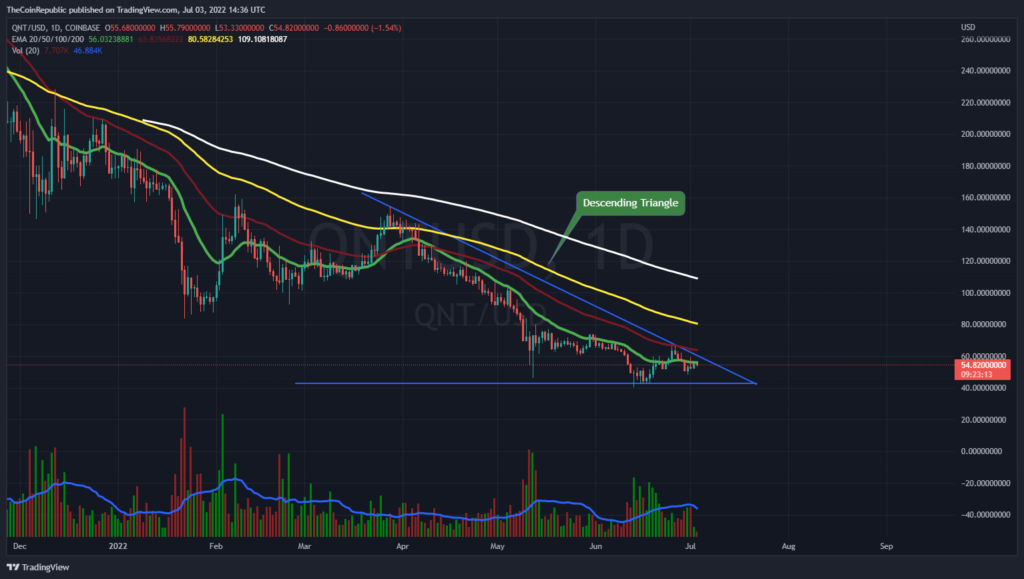
QNT coin price has been declining through a descending triangle pattern over the daily price chart. The token must accumulate more buyers in order to break out of the falling pattern. However, gradually declining volume change signifies the fall of QNT coin through a descending triangle pattern. Volume must be increased for QNT to escape the pattern.
Support on the lower end is at $48.00 and resistance on the higher side is at $60.00.
What do Technical Indicators Suggest about QNT?
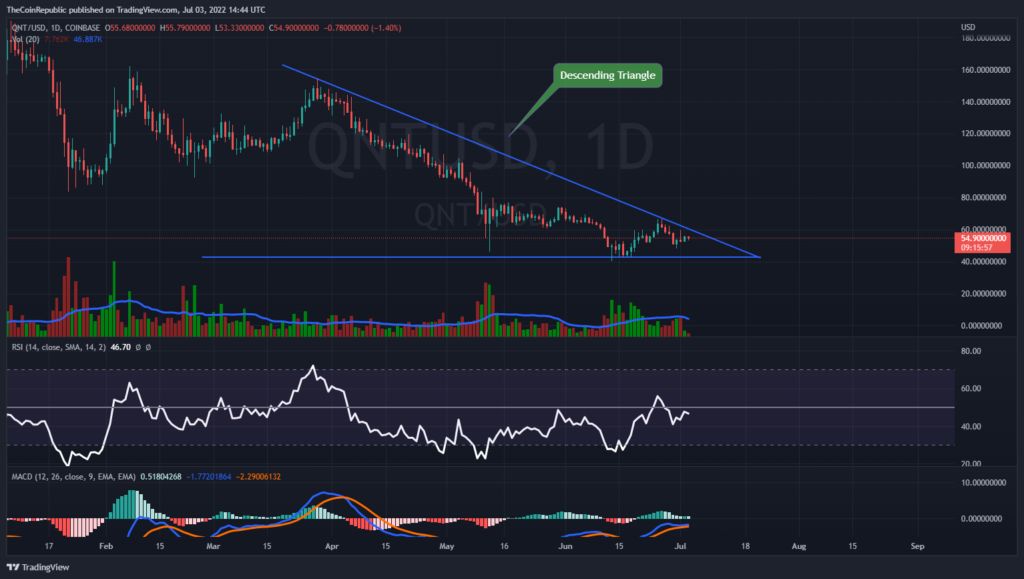
QNT coin needs to attract a significant number of buyers in order to escape the descending triangle pattern. However, the token is currently in the make-or-break situation and technical indicators confirm the token’s downtrend momentum. Relative Strength Index showcases the bearish momentum of QNT coin. RSI is at 46 and is heading towards the oversold territory below neutrality. MACD exhibits the downtrend momentum of QNT coin. The MACD line is about to cross the signal line downwards resulting in a negative crossover. QNT investors need to wait for any directional change over the daily price chart.
Conclusion
Quant price has been falling through a descending triangle pattern over the daily price chart. The token falters to gain uptrend momentum and sustain out of the descending triangle pattern. QNT coin must accumulate buyers in order to escape the descending triangle pattern over the daily price chart. However, gradually declining volume change signifies the fall of QNT coin through a descending triangle pattern. Volume must be increased for QNT to escape the pattern. However, the token is currently in the make-or-break situation and technical indicators confirm the token’s downtrend momentum. QNT investors need to wait for any directional change over the daily price chart.
Technical Levels
Support Levels: $48.00 and $42.00
Resistance Levels: $60.00 and $65.00
Disclaimer
The views and opinions stated by the author, or any people named in this article, are for informational ideas only, and they do not establish the financial, investment, or other advice. Investing in or trading crypto assets comes with a risk of financial loss.
ALSO READ: Crypto Firms In The US Have Paid Over $3 Billion In Fines

Nancy J. Allen is a crypto enthusiast, with a major in macroeconomics and minor in business statistics. She believes that cryptocurrencies inspire people to be their own banks, and step aside from traditional monetary exchange systems. She is also intrigued by blockchain technology and its functioning. She frequently researches, and posts content on the top altcoins, their theoretical working principles and technical price predictions.


