
 Home
Home News
News

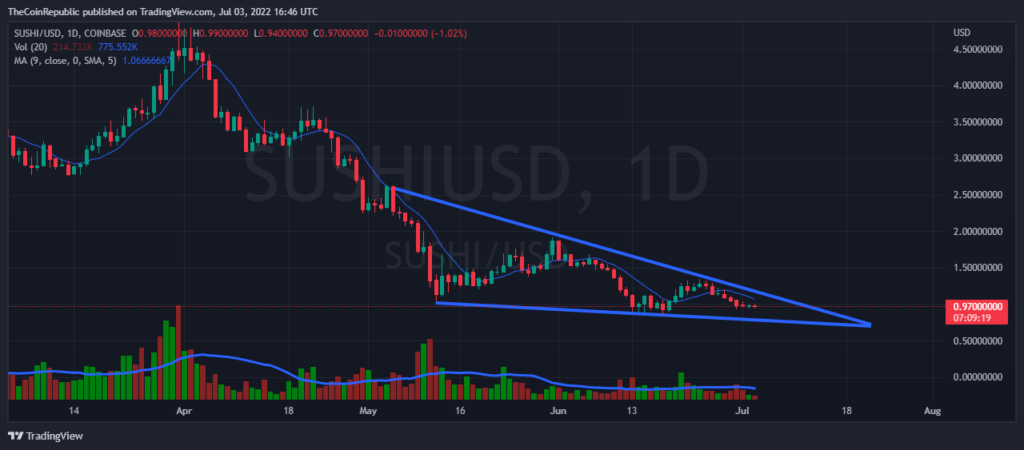
- The price has entered in a falling wedge pattern over the daily price chart and now the bears are about to make a breakdown.
- The technical indicators are for a little help but indicate an overall downtrend movement ahead.
- The SUSHI/BTC pair is at 0.00005084 BTC with a mere gain of 0.16%.
SushiSwap (SUSHI) is an example of an automated market maker (AMM). An increasingly popular tool among cryptocurrency users, AMMs are decentralized exchanges which use smart contracts to create markets for any given pair of tokens.

The SUSHI price trying to recover has now fallen into a falling wedge pattern over the daily price chart. The bears are dominating the price continuously and trying to register a breakdown and if the same happens the price will fall to its crucial support level of $0.5 and it will be very difficult for the SUSHI bulls to make the coin recover. The token needs its bulls to oppose the movement and make a breakout so the investors can take a calm breath. The price is moving considerably low below the exponential moving average.

Current price for one SUSHI token is trading at $0.97 which is at a loss of 0.69% in its market capitalization in the last 24 hrs session. The token has a trading volume of 51 million with a loss of 11.14% in the 24 hrs trading session and a market cap of 123 million. The volume market cap ratio is 0.418.
What do Technical Indicators Suggest
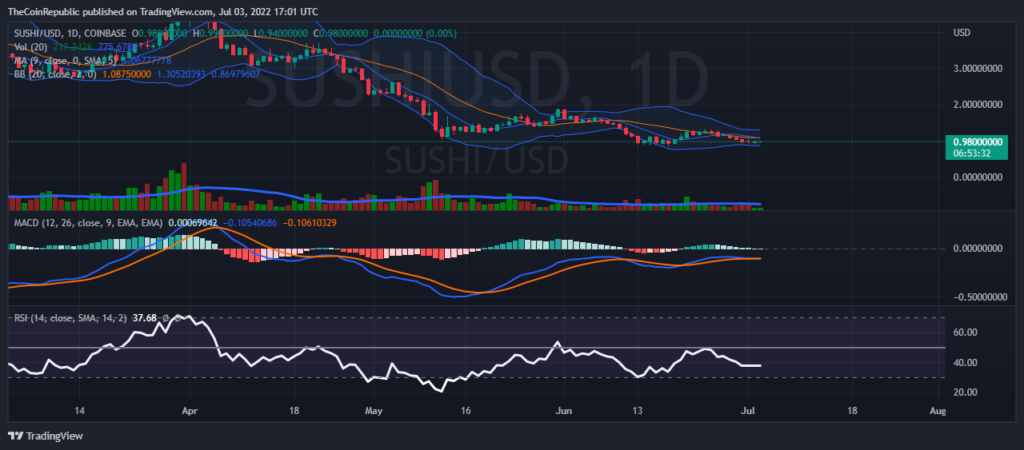
The trading volume fell 11% and now is moving below average. The bollinger band cloud is moving neutrally at present. Whereas on the MACD indicator the line which indicates the sellers signal (red) is dominating and we can witness a negative crossover anytime, this indicates a bearish rally ahead. The relative strength index line is moving neutrally showing the equality between buyers and sellers. The RSI value is below 40. The bulls need to increase this RSI value in order to support the price.
Conclusion
The SUSHI price trying to recover has now fallen into a falling wedge pattern over the daily price chart. The token needs its bulls to oppose the movement and make a breakout so the investors can take a calm breath. While the price is moving considerably low below the exponential moving average. The technical indicators overall indicate a dominance by sellers, so the price may fall further. The investors need to think before taking any step.
Technical levels
Resistance levels: $1.14 and $1.32
Support levels: $0.84 and $0.70
Disclaimer
The views and opinions stated by the author, or any people named in this article, are for informational ideas only, and they do not establish the financial, investment, or other advice. Investing in or trading crypto assets comes with a risk of financial loss.
ALSO READ: Even with staggering valuation, what’s the major issue with the Defi market space?

Nancy J. Allen is a crypto enthusiast, with a major in macroeconomics and minor in business statistics. She believes that cryptocurrencies inspire people to be their own banks, and step aside from traditional monetary exchange systems. She is also intrigued by blockchain technology and its functioning. She frequently researches, and posts content on the top altcoins, their theoretical working principles and technical price predictions.


