
 Home
Home News
News

- Flow price is trading with downtrend momentum inside the consolidation phase over the daily price chart.
- FLOW crypto tried to sustain at 20 EMA but struggled due to short-selling pressure.
- The pair of FLOW/BTC is at 0.00008085 BTC with an intraday gain of 1.66%.
With a sustained uptrend momentum across the daily price chart, Flow price is attempting to rebound. In order to break out of the consolidation period over the chart, the token must amass buyers. FLOW currency is making an attempt to climb toward the upper trendline of the horizontal range-bound area. To break through the consolidation period, FLOW needs to keep up this uptrend momentum. It also needs to keep up this uptrend momentum to rise from its own ashes. FLOW has been consolidating around the $1.40 to $1.85 price range. However, FLOW coin falters to maintain the uptrend momentum and is falling towards the lower trendline over the chart.

Flow price’s CMP is $1.56 at the moment, and it has increased by 0.44 percent in market value over the previous 24 hours. In the intraday trading session, the volume of transactions climbed by 38.05 percent. This demonstrates that Flow is luring traders with its offerings. It is 0.0203 for the volume to market cap ratio.

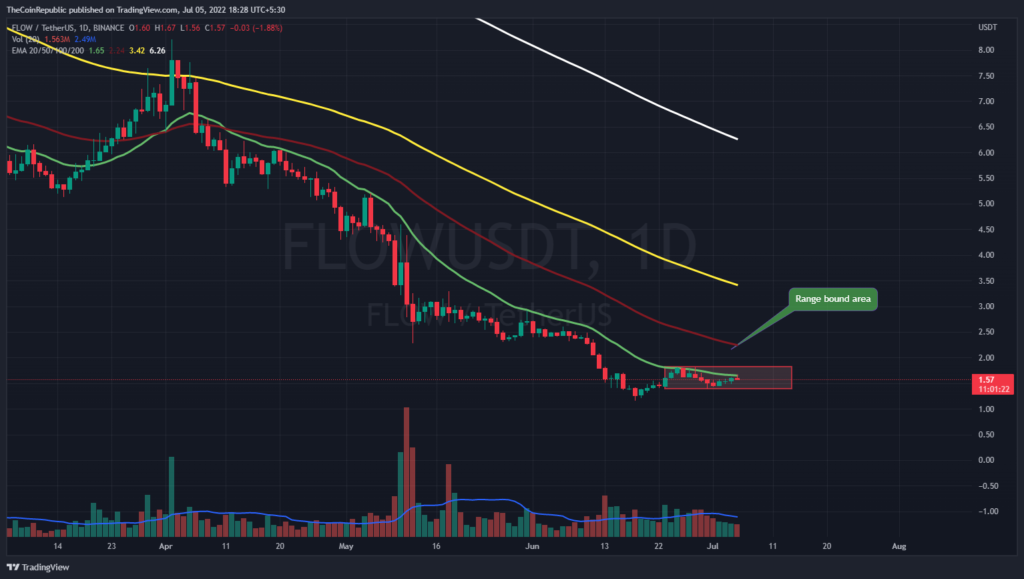
FLOW coin price struggles to maintain the uptrend momentum and is facing short-selling pressure. Bears are trying to disturb the flow of the token and are pulling it back towards the lower trendline of the consolidation area. Meanwhile, volume change can be seen below average and needs to grow for FLOW to sustain and maintain its uptrend momentum. The doji candle signals the trend reversal of the FLOW coin.
Will FLOW maintain its ‘flow’?
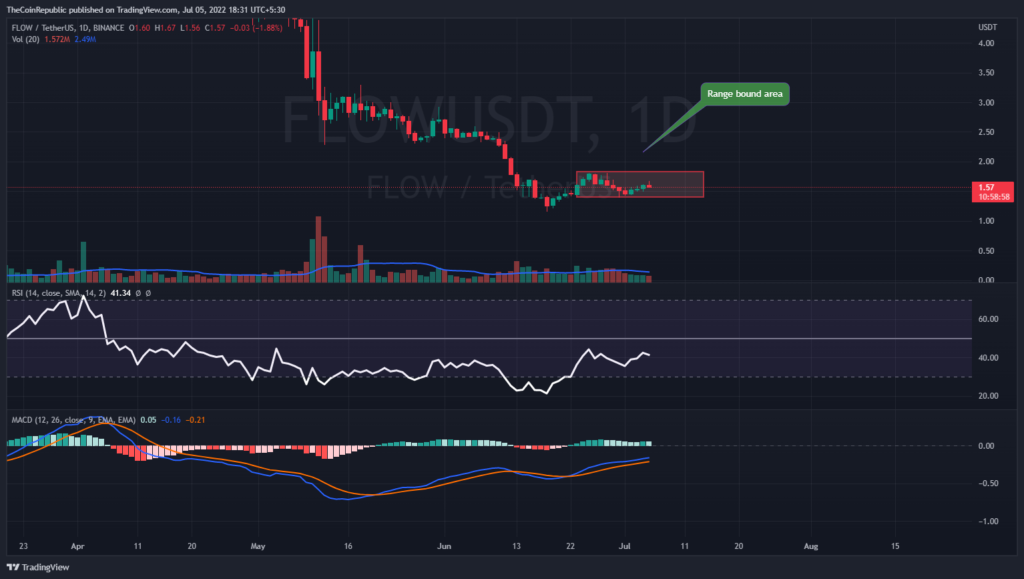
FLOW coin price is facing correction inside the consolidation phase and is trading towards the lower range. The token must sustain at the current level to avoid the severe consequences of this trend reversal. Technical indicators suggest the consolidation phase of FLOW coin. Relative Strength Index showcases the downtrend momentum of FLOW coin. RSI is at 41 and is below neutrality.
MACD exhibits the consolidation phase of the token. The MACD line is ahead of the signal line but with a minor difference and it may register the negative crossover. FLOW investors need to wait for any directional change over the chart.
Conclusion
With a sustained uptrend momentum across the daily price chart, Flow price is attempting to rebound. In order to break out of the consolidation period over the chart, the token must amass buyers. FLOW currency is making an attempt to climb toward the upper trendline of the horizontal range-bound area. Despite being the most dominant currency, BTC is still below the $20,000 threshold. Meanwhile, volume change can be seen below average and needs to grow for FLOW to sustain and maintain its uptrend momentum. The doji candle signals the trend reversal of the FLOW coin. Technical indicators suggest the consolidation phase of FLOW coin. FLOW investors need to wait for any directional change over the chart.
Technical Levels
Support Levels: $1.40 and $1.20
Resistance Levels: $1.85 and $2.00
Disclaimer
The views and opinions stated by the author, or any people named in this article, are for informational ideas only and do not establish the financial, investment, or other advice. Investing in or trading crypto assets comes with a risk of financial loss.
ALSO READ: Christie’s to auction NFT of COVID-19 vaccine

Andrew is a blockchain developer who developed his interest in cryptocurrencies while pursuing his post-graduation major in blockchain development. He is a keen observer of details and shares his passion for writing, along with coding. His backend knowledge about blockchain helps him give a unique perspective to his writing skills, and a reliable craft at explaining the concepts such as blockchain programming, languages and token minting. He also frequently shares technical details and performance indicators of ICOs and IDOs.


