
 Home
Home News
News
- Bitcoin Cash price is trading with sideways momentum over the daily price chart.
- BCH crypto has fallen below the 20, 50, 100, and 200-day Daily Moving Average.
- The pair of BCH/BTC is at 0.005056 BTC with an intraday gain of 0.29%.
The daily price chart shows that the price of bitcoin cash is currently trending downward and toward the lower levels of 2018. The token needs to gather buyers in order to avoid the consolidation period. BCH coin has to develop support to avoid falling below the 2018 lows. In order to try to reverse the trend, it also needs support. BCH investors are keeping an eye on the daily price chart in anticipation of a trend reversal and a recovery phase. The BCH coin price is attempting to recover after consolidating at 2018 lows. To register its recovery phase, the token needs to garner support from the buyers.

The current estimated price of Bitcoin Cash is $96.18, and on the previous day, it lost 3.12% of its market capitalization. However, the intraday trading session saw a 2.42% drop in trade volume. This demonstrates how BCH bears are attempting to accumulate so that the coin can begin to remain in the bearish momentum. The volume to Market capitalization ratio is 0.6252.

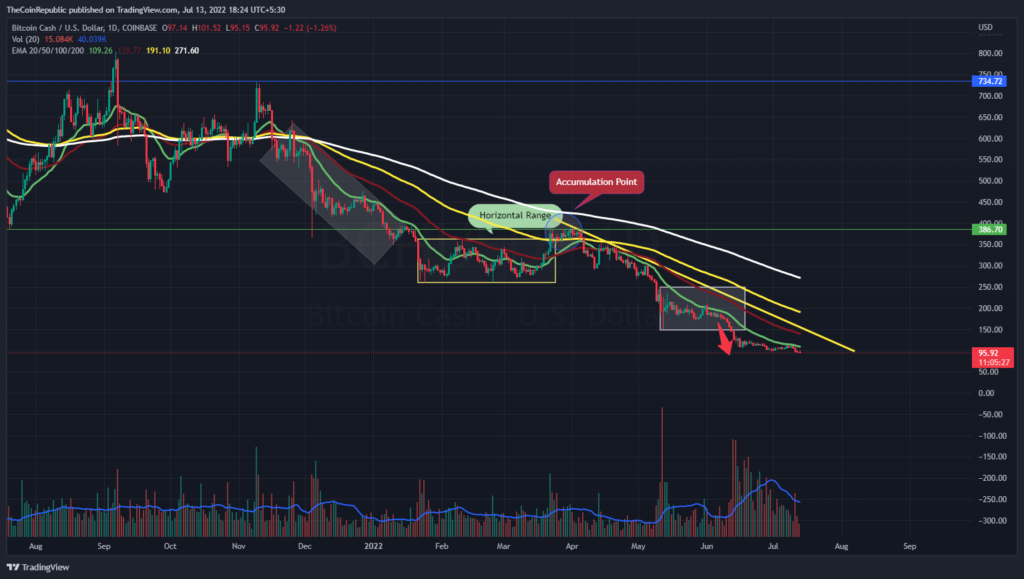
The price of the BCH coin has fallen through some interesting patterns on the daily price chart. A channel that was dropping before settling for a while has been broken by the cryptocurrency asset. After that, BCH bulls tried to break out of the consolidation period but failed, trading bearishly to 2018 lows. More buyers are needed to stop the BCH price from falling even further.
What do Technical Indicators suggest about BCH?
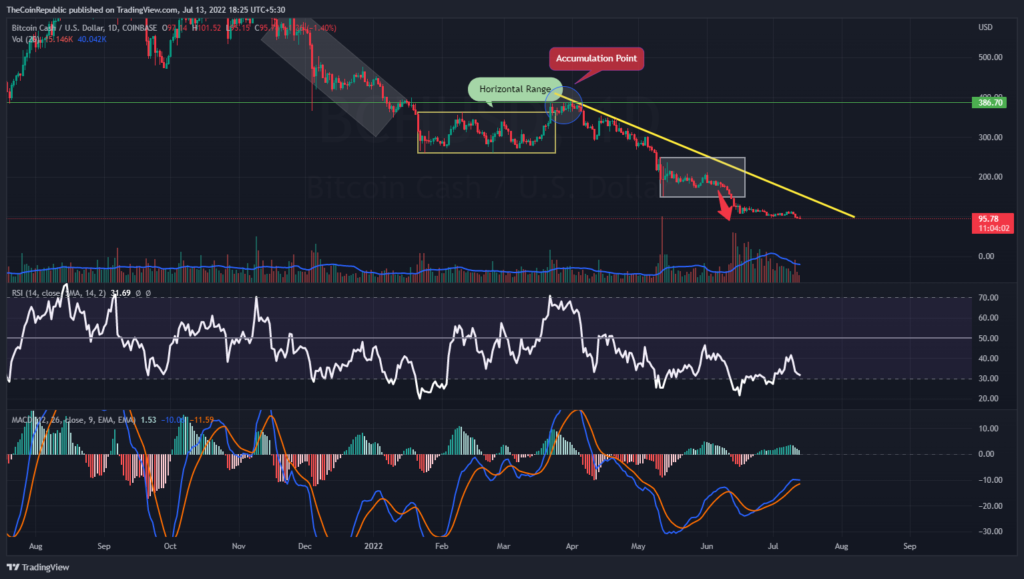
BCH coin price needs to attract a substantial number of buyers in order to reverse the bearish momentum over the daily price chart. The momentum of the BCH coin’s downward trend is shown by technical indicators.
At the low of 2018, the Relative Strength Index clearly shows BCH’s consolidation phase. At 31, the RSI is approaching oversold territory. The BCH coin’s sideways motion is visible on the MACD. They are inching closer to the signal line for a negative crossover. Investors in BCH must wait for any directional change before drawing any conclusions about the coin’s price movement.
Conclusion
The daily price chart shows that the price of bitcoin cash is currently trending downward and toward the lower levels of 2018. The token needs to gather buyers in order to avoid the consolidation period. BCH coin has to develop support to avoid falling below the 2018 lows. In order to try to reverse the trend, it also needs support. BCH investors are keeping an eye on the daily price chart in anticipation of a trend reversal and a recovery phase. After that, BCH bulls tried to break out of the consolidation period but failed, trading bearishly to 2018 lows. More buyers are needed in order to stop the price of BCH from falling even further. BCH coin’s downward trend is shown by technical indicators. The BCH coin’s sideways motion is visible on the MACD. Inching closer to the signal line for a negative crossover. Investors in BCH must wait for any directional change before drawing any conclusions about the coin’s price movement.
Technical Levels
Support Level: $95.00 and $90.00
Resistance Level: $100 and $110
Disclaimer
The views and opinions stated by the author, or any people named in this article, are for informational ideas only, and they do not establish the financial, investment, or other advice. Investing in or trading crypto assets comes with a risk of financial loss.

Andrew is a blockchain developer who developed his interest in cryptocurrencies while pursuing his post-graduation major in blockchain development. He is a keen observer of details and shares his passion for writing, along with coding. His backend knowledge about blockchain helps him give a unique perspective to his writing skills, and a reliable craft at explaining the concepts such as blockchain programming, languages and token minting. He also frequently shares technical details and performance indicators of ICOs and IDOs.


