
 Home
Home News
News
- BAT token has fallen off the long-term demand zone and recently it started trading in a small range.
- BAT token price is trading in a no-trading zone, as it consolidates.
- The pair of BAT/BTC is trading at 0.00001848 with an increase of 0.10% in the past 24 hours.
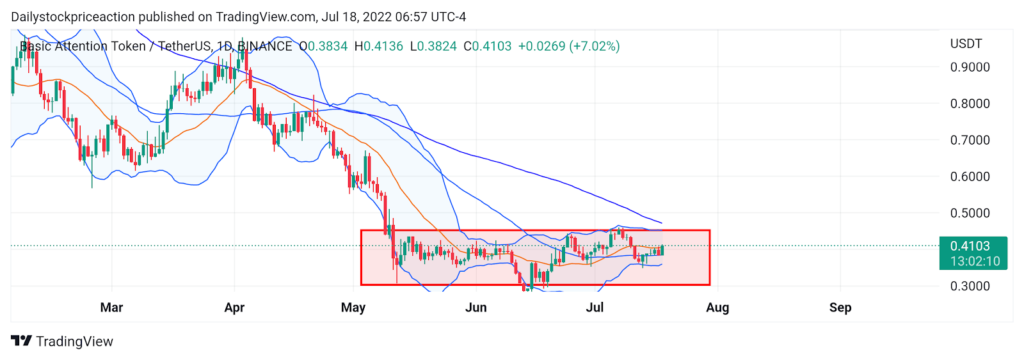
BAT token price, despite the recent bullishness in the past 72 hours is falling continuously after facing rejection off the $0.4500.At present, the token has started consolidating in a small range and a breakout on either side could trigger a big move. BAT token price fell or was $0.600 with a strong bearish candlestick pattern. This breakdown zone can act as a strong supply zone moving upwards. Currently, the BAT token price is trading in the middle of the Bollinger Band indicator.

The token failed to break down the lower band of the Bollinger band indicator as it bounced back with a strong bullish candlestick pattern of it. At present, the BAT token price is trading above 20 and 50 MA and below 100 MA. The token can face rejection of 100 MA moving upwards. Investors should wait for the breakout on either side and then take positions accordingly. Volumes have not seen any changes and are normal, therefore the trend still seems to be bearish and the consolidation just seems to be at a halt.

BAT token price is trading in a small range on a daily time frame
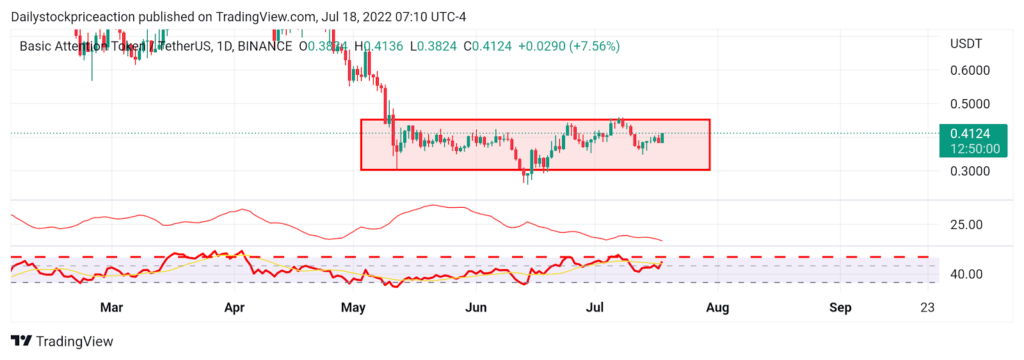
BAT token price, as the technical parameters suggest, is showing bullish signs. As per price action, the token can be seen hovering around the supply zone.
Relative Strength Index: RSI is trading at 53.70 as the tone price nears the supply zone of $0.450. The BAT token price has been trading in a small range and rising towards the supply zone which has resulted in the RSI curve giving a breakout of 14 SMA. This could result in the short-term bullish momentum in the price of BAT token price.RSI token has also crossed the halfway mark of 50, suggesting a bullish momentum to continue.
Average Directional Movement Index: Despite the token hovering around the supply zone, the ADX curve has slipped below 25. As the token consolidates, the ADX curve is seen to lose strength, which could be a bad sign for the BAT token price. Although, ADX has turned sideways indicating a halt in the price movement. It remains to see if the tone changes the price movement structure to higher high and higher lows from lower low and lower high. If it does so, there can be a short-term bullish move seen in the BAT then price, pushing the price up towards $0.450.
BAT token price has broken off the long-term demand zone on the weekly time frame
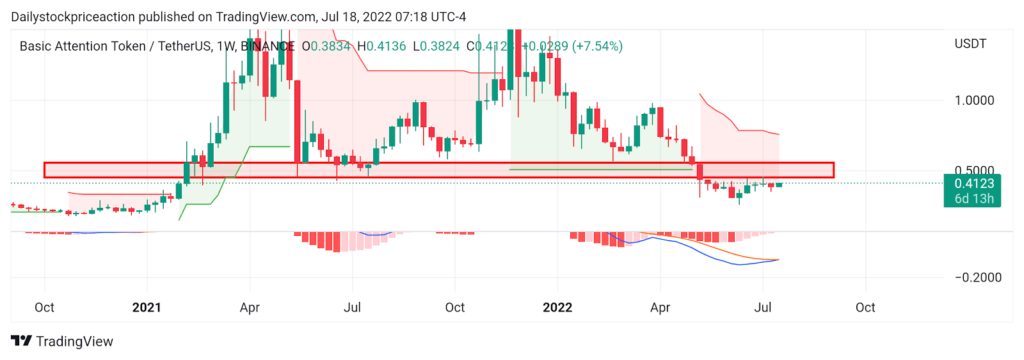
BAT token price, as per the price action, has broken off the long-term demand zone, which is now acting as a strong supply zone.
Supertrend: BAT token price is hovering along the long-term supply zone of $0.50 and the recent bullishness in the price of BAT token just seems to be a retest of the breakdown zone. A strong bearish candlestick pattern formation at the supply sone will confirm the bearish trend therefore investors should wait for the BAT token price to give confirmation. The super trend indicator gave a sell signal way back when the BAT token price broke down the important demand zone of $0.50, during the last 6 month sell-off.
Moving Average Convergence Divergence: MACD has also given a negative crossover as the token price broke off the long-term demand zone of $0.50. The blue line crossed the orange line on the downside. Although the Blue line has touched the Orange line, it could be due to a retest of the supply zone and as the token falls, the lines can be seen widening.
Conclusion
Despite the recent bullishness in the overall cryptocurrency market, the BAT token price is still in a downtrend as seen on the charts. As the technical parameters suggest, the recent bullishness could just be a retest of the supply zone for the further downside move. Investors should wait for a confirmation of a particular trend.
SUPPORT: $0.35 and $0.32
RESISTANCE: $0.45 and $0.50
Disclaimer
The views and opinions stated by the author, or any people named in this article, are for informational ideas only, and they do not abolish financial, investment, or other advice. Investing in or trading crypto assets comes with a risk of financial loss.
Saurav Bhattacharjee is in charge of the Broadcast development team of The Coin Republic.
He has been covering the Metaverse and NFT niche for the past 2 years.
With stellar interviews on his portfolio like Nicehash, Paxful, WallstreetWolvesNFT, Bitholla, Totemfi, EOS.io etc. Saurav has spearheaded the NFT SUPERSTARS AWARD and successfully hosted the first award in 2021.


