
 Home
Home News
News

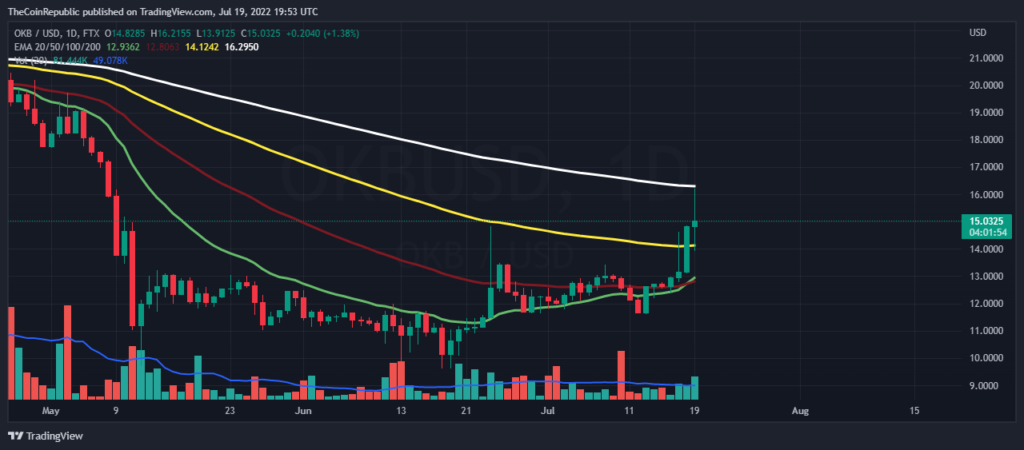
- The OKB price is going in a strong uptrend over the daily price chart after experiencing bearish pressure.
- The crypto asset is moving above the 20, 50, 100 days moving average and is approaching the 200 days one.
- The OKB/BTC pair is at 0.0006455 BTC which is at a loss of 1.84%.
The OKEx utility token, or OKB, gives customers access to the unique features of the cryptocurrency exchange. The coin is used to determine and pay trading commissions, give users access to platform voting and governance, and pay users for holding OKB.

Following a bearish pressure, the OKB price is moving in a strong uptrend over the daily price chart. This shows the bulls’ efforts over the token which made the price surge more than 30% in 7 days. While the bears made their presence known by driving up the price, the bulls are currently in control of the market and have prevented the bears from taking full control. Over the period of the intraday trading session, the OKB trading volume has increased by 32 percent and is still rising.

The current price for one OKB token is hovering at $15.11 which is at a gain of 6.14% in its market capitalization in the last 24 hrs. The token has a reading volume of 22 million which is at a gain of 32.59% in the 24 hrs trading session and has a market cap of 906 million. The volume market cap ratio of OKB is 0.02548.
Will this Bullish Trend Fade?
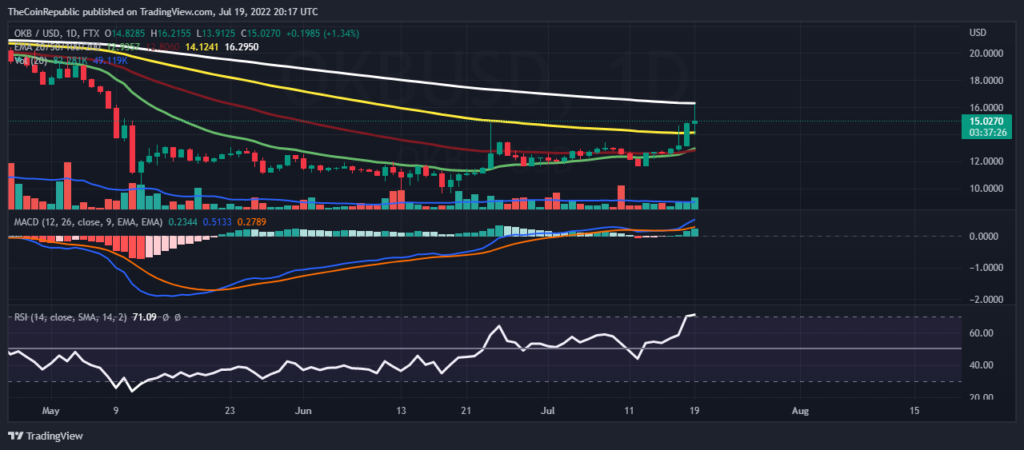
While observing the OKB price over the daily and hourly chart the conditions appear to be in favor of the bulls this time.
The MACD indicator shows the buyer’s line is moving above the seller’s signal line along with the histograms growing green which signifies the buyers are actively participating and dominating the market. The relative strength index crossed the mark of overbought amid the bullish dominance over the daily chart. The RSI value for OKB is above 70 currently. This can be an alarming call for the investors as the price may fall after being overbought so they need to be alert before making any move.
Conclusion
OKB price is moving in a strong uptrend over the daily and hourly price chart. The bulls are currently in control of the market and have prevented the bears from taking full control. Over the period of the intraday trading session, the OKB trading volume has increased by 32 percent. The technical indicators are in favor of the bulls for now.
Technical levels
Resistance levels: $16.27 and $19.4
Support levels: $12.54 and $11.60
Disclaimer
The views and opinions stated by the author, or any people named in this article, are for informational ideas only, and they do not establish the financial, investment, or other advice. Investing in or trading crypto assets comes with a risk of financial loss.

Andrew is a blockchain developer who developed his interest in cryptocurrencies while pursuing his post-graduation major in blockchain development. He is a keen observer of details and shares his passion for writing, along with coding. His backend knowledge about blockchain helps him give a unique perspective to his writing skills, and a reliable craft at explaining the concepts such as blockchain programming, languages and token minting. He also frequently shares technical details and performance indicators of ICOs and IDOs.


