
 Home
Home News
News

- The Bitcoin Gold coin has gained an incredible 26% in the last 24 hours.
- Despite the recovery, BTG coin is still trading in a falling pattern.
- Speculators witnessed a highly volatile session last night as trading volume jumped over 530%.
The Bitcoin Gold coin has displayed price stability since mid-June. BTG crypto has been witnessing a decline since September 2021. Amidst the roller coaster ride, buyers witnessed a sell-off in each rise. We can say that BTG coin is still struggling for a selling on rise formation as the bulls are yet to break the previous swing high.

Price action shows lower-low and lower-high formation inside a falling wedge pattern (bottom of chart). Buyers are accumulating the altcoin price to break this bearish range as soon as possible.

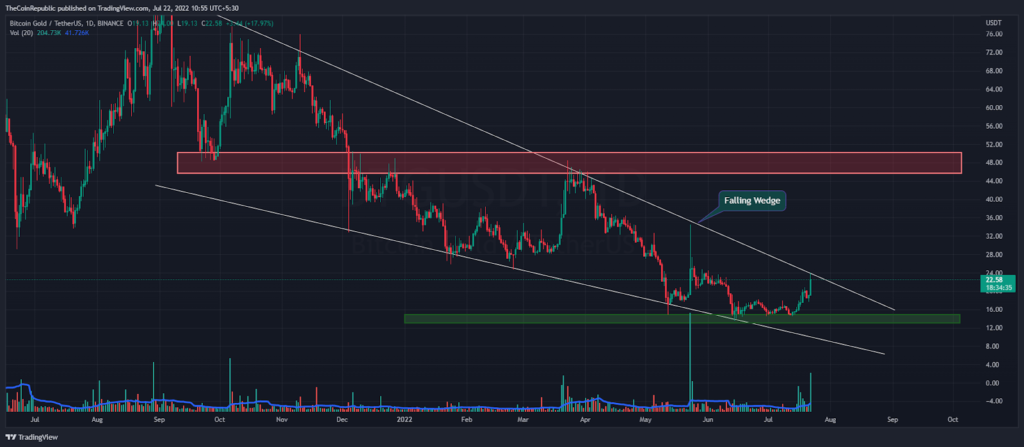
Bitcoin Gold (BTG) price recently noted at a 2022 low of $13.5 mark, bears have several attempts to enter another low, but unfortunately buyers saw it as a hedge zone (green zone). changed into As a result, buying has been taking place over the past few days while the BTG token is trading at the $22.5 mark at the time of writing.
As of writing, the bulls are targeting a sell break by breaking the descending wedge pattern. Meanwhile, the coins recovered around 27% this week. Buyers are looking aggressive today, resulting in a 26% increase in the market cap over the past 24 hours and a near $400 million valuation nearing completion.
BTG Price Trade Close to Selling Zone
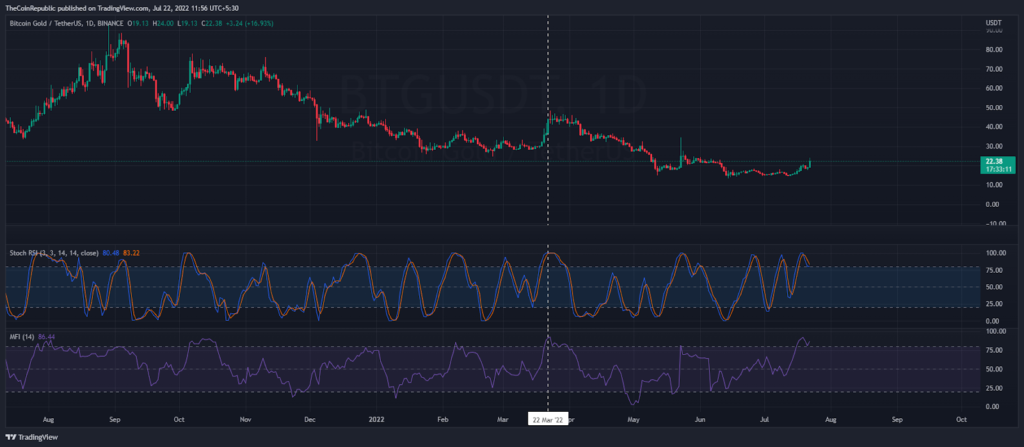
Trading volume is increasing gradually where buyers are managing BTG price in higher zone. Stoch RSI is showing slight weak momentum as it closed in the overbought zone. Minor pull backs are ahead based on the given indicator.
The Money Flow Index (MFI) moved up sharply after July 10, with the indicator moving into the greed zone at 86-point during the daily price chart Pullbacks
Conclusion
The MFI indicator reached an extreme high zone, at the same time that the price of Bitcoin Gold moved closer to the upper boundary of the descending wedge pattern. Therefore, if the bulls fail to break the resistance trendline, a minor retracement could lie ahead.
Support level – $20 and $14
Resistance level – $28 and $50
Disclaimer
The views and opinions stated by the author, or any people named in this article, are for informational ideas only, and they do not establish financial, investment, or other advice. Investing in or trading crypto assets comes with a risk of financial loss.
Saurav Bhattacharjee is in charge of the Broadcast development team of The Coin Republic.
He has been covering the Metaverse and NFT niche for the past 2 years.
With stellar interviews on his portfolio like Nicehash, Paxful, WallstreetWolvesNFT, Bitholla, Totemfi, EOS.io etc. Saurav has spearheaded the NFT SUPERSTARS AWARD and successfully hosted the first award in 2021.


