
 Home
Home News
News

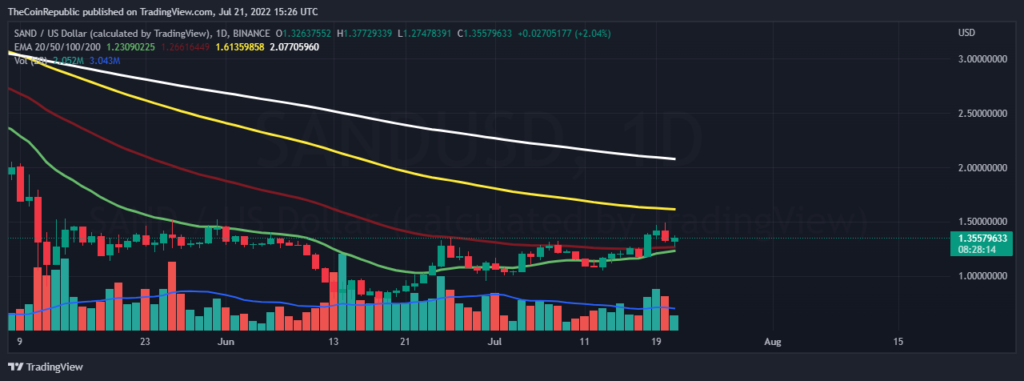
- The SAND price has begun to recover over the daily price chart, although the entire market is declining due to BTC dominance.
- The crypto asset is trading above the 20, 50, 100 and 200 day moving average over the hourly price chart.
- The SAND/BTC pair is at 0.00006008 BTC with a gain of 2.46%.
A blockchain-based virtual world called The Sandbox lets users create, produce, purchase, and trade digital goods in the form of games. The Sandbox develops a decentralized platform for a successful gaming community by fusing the strengths of DAO and NFTs.

Where the whole market is sinking amid the BTC domination, here the SAND price has started recovering over the daily price chart. The SAND price started sinking, but the SAND bulls came at the right time to support the token and save their previous efforts in making the token recover. The recovery is very small but it is a sign of relief for the investors. The trading volume is moving below the average and it looks like the bulls are working on it.

The current price for one SAND token is moving at $1.36 and it is at a loss of 3.94% in its market capitalization in the 24 hrs. The token has a trading volume of 559 million which is at a loss of 9.18% over the intraday trading session and has a market cap of 1.7 billion. The volume market cap ratio for SAND is 0.3289.
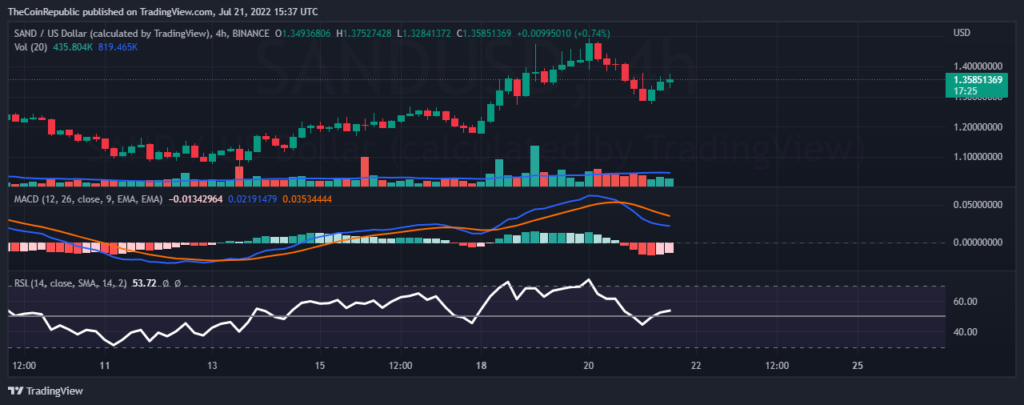
Short-term Analysis
While observing the chart for a short term (4 hrs) we can observe the initiation of an uptrend movement after the domination by BTC.
We can observe the fading of the red histograms over the MACD indicator, but still the sellers signal line is moving above the buyers line and if the bulls are consistent we can soon witness a positive crossover. In support the relative strength index has started moving towards the upper region. The RSI value is above 50 currently and to speed up the process the token needs to attract some more buyers.
ALSO READ – Blockchain.com Laid Off 25% of Its Staff
Conclusion
Where the whole market is sinking amid the BTC domination, here the SAND price has started recovering over the daily and hourly price chart. The recovery is very small but it is a sign of relief for the investors. The technical indicators indicate a bullish run ahead over the hourly time frame. Hence a sign of relief for the investors and this can be a good time to make a swing entry to the market.
Technical levels
Resistance levels: $1.50 and $1.93
Support levels: $1.17 and $1.05
Disclaimer
The views and opinions stated by the author, or any people named in this article, are for informational ideas only, and they do not establish the financial, investment, or other advice. Investing in or trading crypto assets comes with a risk of financial loss.

Nancy J. Allen is a crypto enthusiast, with a major in macroeconomics and minor in business statistics. She believes that cryptocurrencies inspire people to be their own banks, and step aside from traditional monetary exchange systems. She is also intrigued by blockchain technology and its functioning. She frequently researches, and posts content on the top altcoins, their theoretical working principles and technical price predictions.


