
 Home
Home News
News

- BCH is strongly following the bearish trend. The downfall of the coin has started
- The current price of the BCH is surfing around $132.73 with a total decline of 4.545 during the intraday trading session
- The pair of BCH/BTC is around 0.005825 BTC
Bitcoin Cash is strongly following the bearish trend the coin is steadily following the -downward momentum the bears have taken over the market of the BCH and now the price of the coin is ruining the investor’s hope to book a profit over the coin. The bulls entered the trade but the bears pulled their legs and the coin started following the downward curve. However, this could be a great opportunity for new investors to enter the trade. The bullish trend started on the 26th of July but the bears entered the trade on the 29th of July after that the bears are manipulating the market it seems that the bulls have given up on the price of the coin

The current price of Bitcoin Cash is at approx $132.73 with a total decline of 4.545 during the intraday trading session and the pair of BCH/BTC is at 0.005825 BTC. The bears are trying so hard to raise the selling pressure over the coin so it could not get up to the marks of the bulls. If the bearish trend continues the price may drop up to the primary support of $117.98 and if the bulls didn’t work hard to enter the trade then the price may reach the secondary resistance of $98.20. The bulls have to get in trade with a better and stronger strategy to beat the bears. If the bull’s strategy works the price may boost up to the primary resistance of $156.67 and if the bears don’t get any chance to enter the trade the price of BCH may reach up to the secondary resistance of $185.19. The investors are eagerly waiting for any further movement over the price of the coin

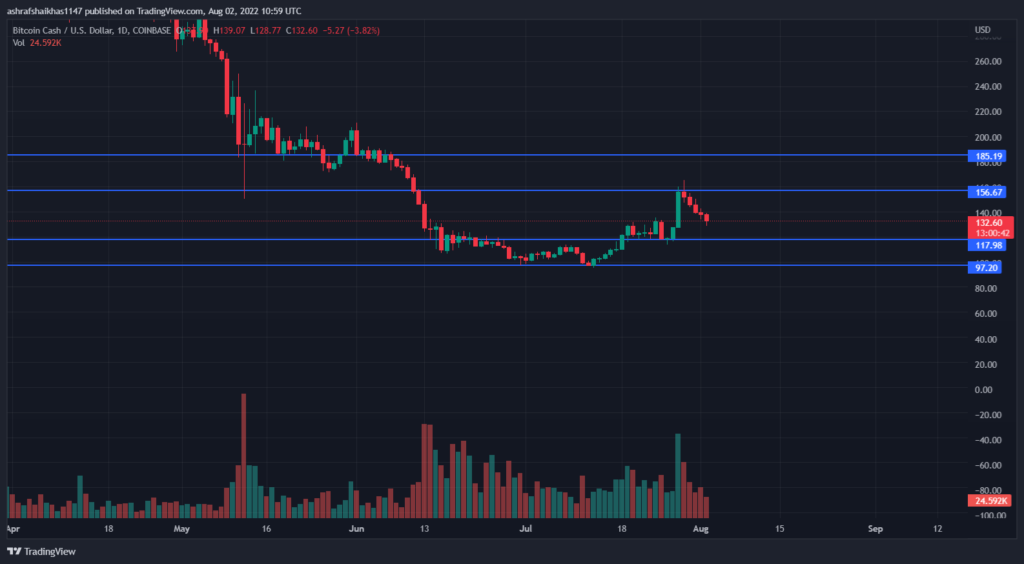
The volume of the coin has dropped by around 26.03% during the intraday trading session the continuous drop in the volume indicates that the selling pressure has increased. The volume to market cap ratio is around 0.1091.
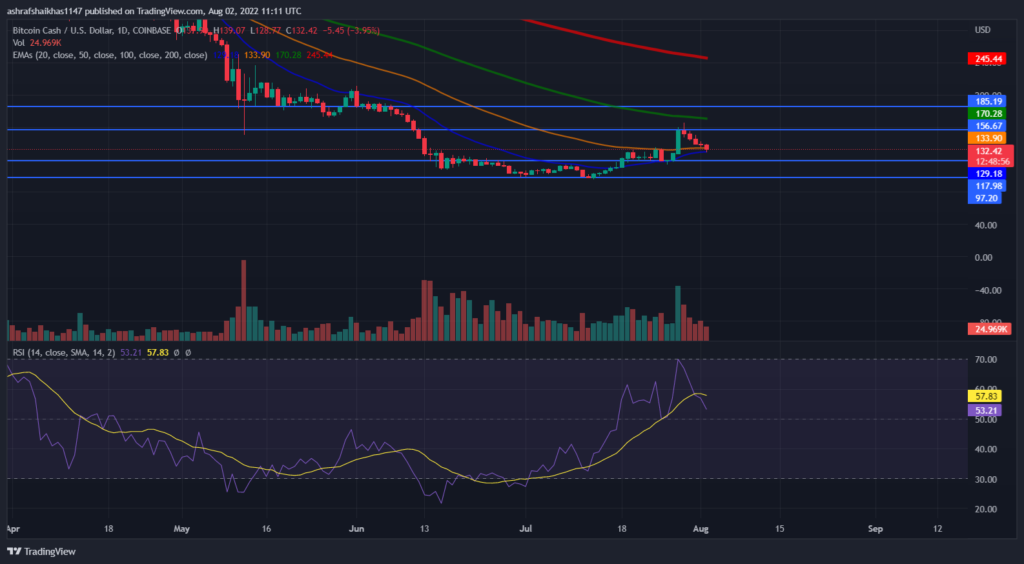
The technical indicator shows the following: The relative strength index is heading to get normalized. The RSI is returning from the overbought zone The bears have knuckled under to normalize the RSI of the BCH. The current RSI is 53.21 which is below the average RSI. the average RSI is 57.83. The price is moving ahead of the 20,50 estimated moving average and is still lagging behind the 100,200 daily moving average.
Technical Levels
Support Levels: $98.20 and $117.98
Resistance Levels: $156.67 and $185.19
Disclaimer
The views and opinions stated by the author, or any people named in this article, are for informational ideas only. They do not establish the financial, investment, or other advice. Investing in or trading crypto assets comes with a risk of financial loss.
Steve Anderson is an Australian crypto enthusiast. He is a specialist in management and trading for over 5 years. Steve has worked as a crypto trader, he loves learning about decentralisation, understanding the true potential of the blockchain.


