
 Home
Home News
News

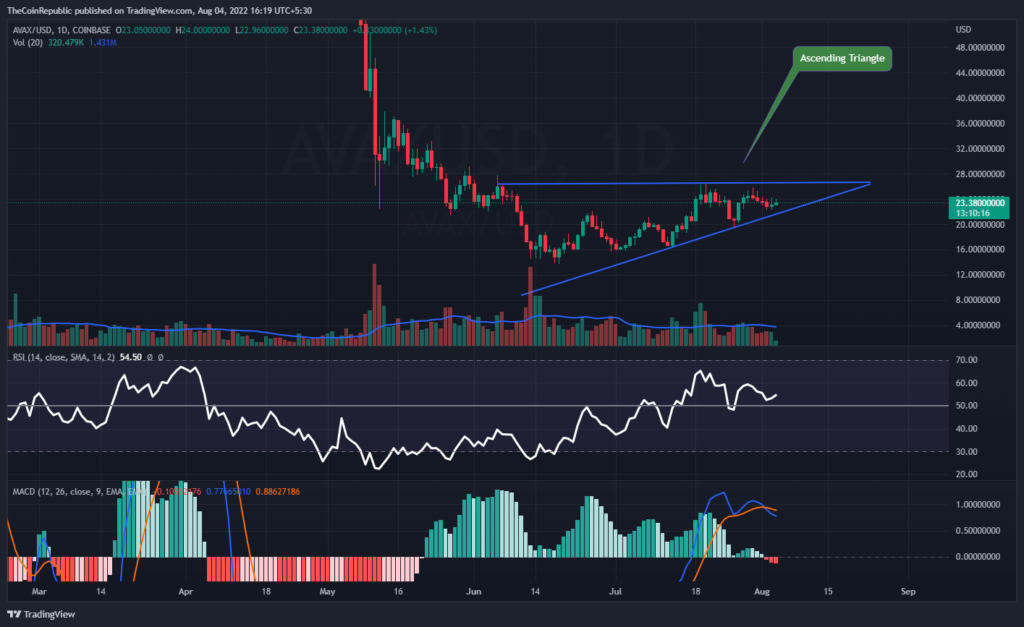
- Avalanche price has been trading inside an ascending triangle pattern over the daily price chart.
- AVAX crypto has recovered till 20 and 50 EMA but still behind 100 and 200-days Daily Moving Average.
- The pair of AVAX/BTC is at 0.001026 BTC with an intraday gain of 1.31%.
Avalanche price has been trading inside an ascending triangle pattern over the daily price chart. The token is trying to recover itself above the neckline of the ascending triangle pattern. AVAX coin must recover itself above the ascending triangle pattern to register its recovery phase. However, the token may experience short-selling pressure as soon as the token reaches the neckline. AVAX bulls need to accumulate themselves to let the token surge towards the upper level. Meanwhile, AVAX bears are gradually declining the volume change in their favor. AVAX investors need to wait for any directional change over the daily chart.

Avalanche price is currently approximated at $23.42 and has lost 0.89% of its market capitalization in the last 24-hour period. Trading volume has decreased by 18% in the intraday trading session. This shows that bears are trying to trap AVAX crypto in the short-sellers’ clutch. Volume to market cap ratio is 0.08114.


AVAX crypto price has been declining over the past trading sessions but the token is now finally bullish and is trying to recover slowly towards the neckline of the ascending triangle at $26.50. AVAX crypto has recovered till 20 and 50 EMA but still behind 100 and 200-days Daily Moving Average. AVAX bulls need to come forward to let the token surge and register its recovery over the daily price chart. However, volume change can be seen below average and needs to grow for AVAX to surge upwards.
Is this a Bullish or Bearish Signal by Technical Indicators?
AVAX coin price is trying to surge towards the neckline of the ascending triangle pattern over the daily price chart. The token still needs to attract more buyers in order to surge towards the upper range and register its breakout. However, technical indicators are divergent over the price action of AVAX crypto.
Relative Strength Index showcases the uptrend momentum of AVAX coin. RSI is at 54 and is heading towards the overbought territory. Nevertheless, MACD exhibits the downtrend momentum of AVAX coin. The MACD line is below the signal line after a negative crossover. AVAX investors must wait for any directional change to predict anything regarding the price action of AVAX coin.
Conclusion
Avalanche price has been trading inside an ascending triangle pattern over the daily price chart. The token is trying to recover itself above the neckline of the ascending triangle pattern. AVAX coin must recover itself above the ascending triangle pattern to register its recovery phase. AVAX bulls need to come forward to let the token surge and register its recovery over the daily price chart. However, volume change can be seen below average and needs to grow for AVAX to surge upwards. Technical indicators are divergent over the price action of AVAX crypto. AVAX investors must wait for any directional change to predict anything regarding the price action of AVAX coin.
Technical Levels
Support Levels: $22.25 and $20.20
Resistance Levels: $25.00 and $26.50
Disclaimer
The views and opinions stated by the author, or any people named in this article, are for informational ideas only, and they do not establish the financial, investment, or other advice. Investing in or trading crypto assets comes with a risk of financial loss.

Nancy J. Allen is a crypto enthusiast, with a major in macroeconomics and minor in business statistics. She believes that cryptocurrencies inspire people to be their own banks, and step aside from traditional monetary exchange systems. She is also intrigued by blockchain technology and its functioning. She frequently researches, and posts content on the top altcoins, their theoretical working principles and technical price predictions.


