
 Home
Home News
News

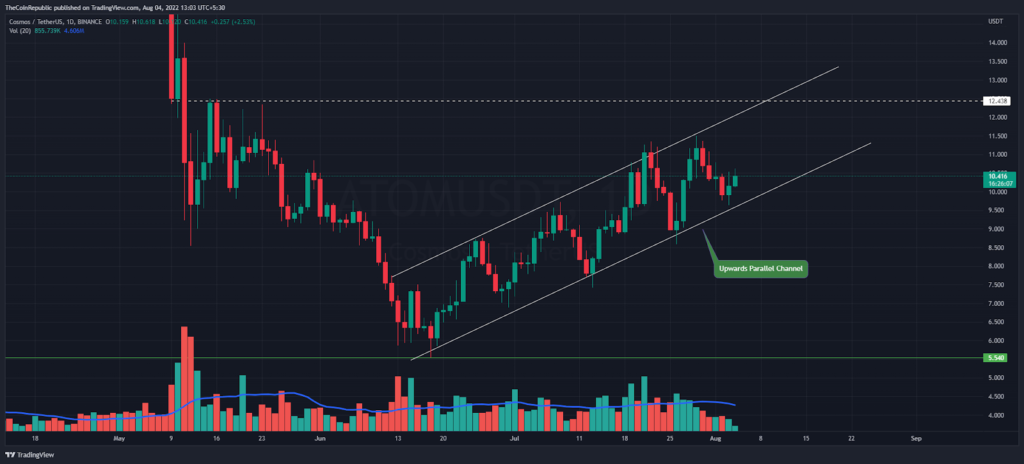
- Cosmos (ATOM) coin continues to move upwards under an ascending parallel channel.
- ATOM speculators saw an 18% increase in trading volume over the past 24 hours.
- ATOM coin with bitcoin pair is up 2.7% at 0.0004522 Satoshis
The Cosmos (ATOM) has been making recovery efforts over the past few weeks. ATOM investors are looking aggressive as the altcoin moves sharply upwards in a parallel channel. On the parallel channel side, new investors consider it a bullish asset for a short-term outlook as there are many resistances to breach.

The ATOM bulls have recently booked themselves near the support trendline of an ascending parallel channel (bottom of chart) on the daily price scale. Buyers can further reach the $12 resistance level, but bears also place their sell orders on the resistance trendline lines of the given pattern. Volatility among recovery assets – trades just above the $10 mark.

At press time, the ATOM token is trading at $10.3 in a bullish range. Last night, buyers looked stronger than sellers, suggesting the $10-zone as key support. This week, the weekly price candle shows a sideways trend inside the previous bullish candle. There seems to be a shortage of buyers this week.
Meanwhile, investors need to add $55 million to ATOM’s market cap to see a total value of $3 billion. Trading volume is gradually decreasing this week against the bullish trend. Furthermore, the trading volume of speculators has seen an increase of 18% in the last 24 hours.
Buyers Have a Support Level of $10
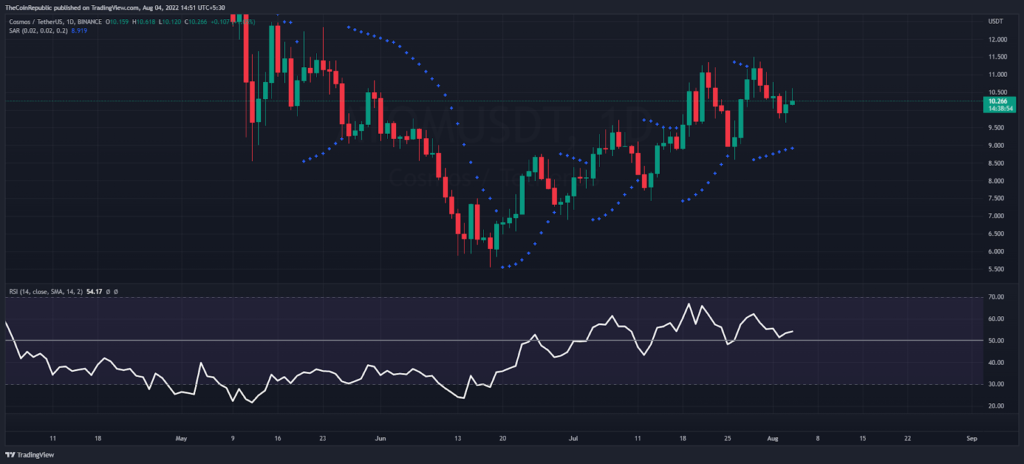
In terms of the daily price scale, the Parabolic SAR indicator is moving below the current price of Cosmos. The RSI indicator has retested the semi-line due to a retracement phase, with the RSI peak again turning to the higher side.
Conclusion
Cosmos (ATOM) coin is looking bullish as buyers reclaim the support trendline of the ascending parallel channel. Buyers can further reach the $12 resistance level, but the bears have also placed their sell orders on the resistance trendline lines of a given pattern.
Support level – $10 and $8.0
Resistance level – $12 and $20
Disclaimer
The views and opinions stated by the author, or any people named in this article, are for informational ideas only. They do not establish financial, investment, or other advice. Investing in or trading crypto assets comes with a risk of financial loss.

Andrew is a blockchain developer who developed his interest in cryptocurrencies while pursuing his post-graduation major in blockchain development. He is a keen observer of details and shares his passion for writing, along with coding. His backend knowledge about blockchain helps him give a unique perspective to his writing skills, and a reliable craft at explaining the concepts such as blockchain programming, languages and token minting. He also frequently shares technical details and performance indicators of ICOs and IDOs.


