
 Home
Home News
News

- After riding the waves of an upswing, the ICP price is presently being dominated by bears on the daily price chart.
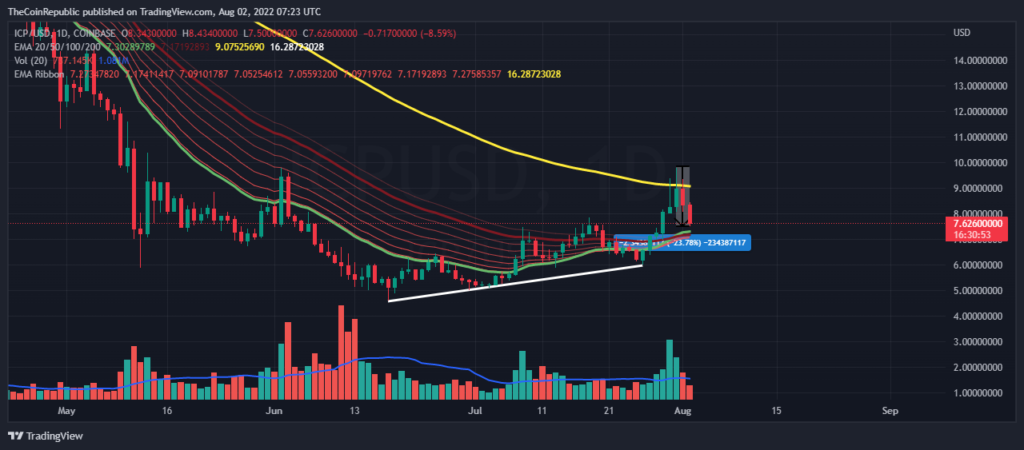
- The crypto asset is moving above the 20 and 50 days moving average after falling below the 100 days average.
- The ICP/BTC pair is at 0.0003339 BTC with a significant loss of 8.39%.
The overarching goal of Internet Computer is to transform the open Internet into a cutting-edge computing platform. ICP’s creators see it as a ground-breaking network since the blockchain is accessible to the general public and has outstanding features.

The ICP price after moving on the waves of an uptrend movement is now facing a bearish dominance over the daily price chart. This signifies that the sellers found this peak interesting and started participating and this accumulation made the price sink. Along with this, BTC is also a major support for bears currently as the BTC price slumped below 23K. Analysts believe that half of the recovery is wasted as the price sank approximately 23% in just 3 days, so the coin needs to attract buyers before it’s too late to make the coin recover.

The current price for one ICP coin is moving at $7.62 which is at a conspicuous loss of 9.72% in its market capitalization in the last 24 hrs. The coin has a trading volume of 162 million which is at a huge loss of 58.86% in the 24 hrs trading session and has a market cap of 1.9 billion. The volume market cap ratio is 0.08647.
What do Technical Indicators Suggest
The volume is still moving below the average and should be a prime concern for the bulls currently as the pumping volume will in turn pump the price.
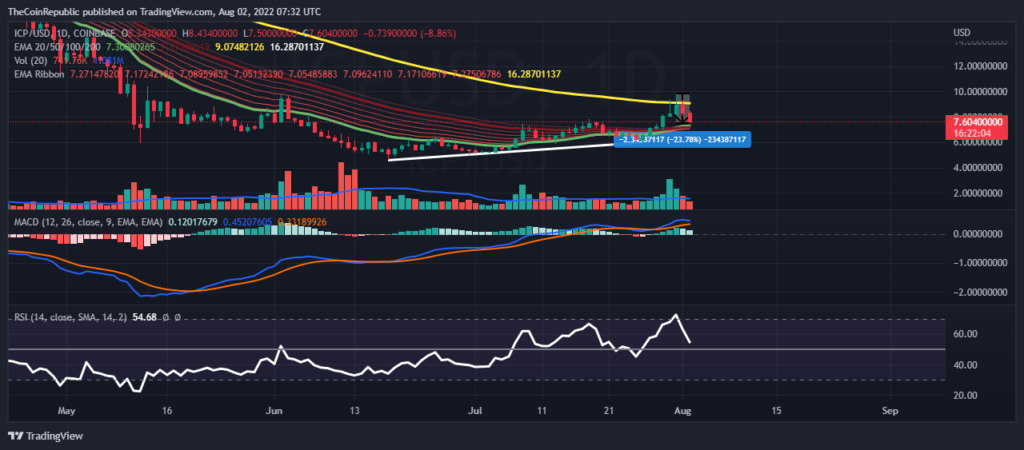
The MACD indicator displays the buyers line moving above the seller’s signal line but the active participation of the sellers is creating a path for a negative cross, the histograms are fading amid the bearish pressure. The relative strength index is diving continuously after being overbought. The RSI value is nearly equal to 55.
Conclusion
The ICP price after moving on the waves of an uptrend movement is now facing a bearish dominance over the daily and hourly price chart. Analysts believe that half of recovery is wasted as the price sinked approximately 23% in just 3 days. The technical indicators exhibit a bearish movement and also support it further. So the investors need to wait before making any move.
Technical levels
Resistance levels: $9.79 and $11.63
Support levels: $ 6.51 and $5.01
Disclaimer
The views and opinions stated by the author, or any people named in this article, are for informational ideas only, and they do not establish the financial, investment, or other advice. Investing in or trading crypto assets comes with a risk of financial loss.
0.0003339 BTC8.39%

With a background in journalism, Ritika Sharma has worked with many reputed media firms focusing on general news such as politics and crime. She joined The Coin Republic as a reporter for crypto, and found a great passion for cryptocurrency, Web3, NFTs and other digital assets. She spends a lot of time researching and delving deeper into these concepts around the clock, and is a strong advocate for women in STEM.


