
 Home
Home News
News

- Tron price has been consolidating since 20th June over the daily price chart.
- TRX crypto is trading at 20 EMA and is preparing for 50, 100, and 200-day Daily Moving Average.
- The pair of TRX/BTC is at 0.000000297 BTC with an intraday gain of 1.23%.
The price of Tron underwent a number of notable adjustments throughout the course of one day. On the daily chart, the cryptocurrency originally entered a downward channel before attempting to reverse direction inside a nearby ascending channel. Then, another correction happened as TRX entered a pattern known as a rounding bottom. During this time, the token went on an interesting roller-coaster ride. The TRX coin is currently striving to keep itself at the consolidation phase’s upper range as the token attempts to find support at a higher level.

Tron’s market capitalization is down 1.90% from yesterday at $0.06778 CMP. In the course of the day, the trade volume decreased by 18.50%. This suggests that bears are attempting to congregate in order to see the token’s decomposition. The volume to market cap ratio is 0.056680.

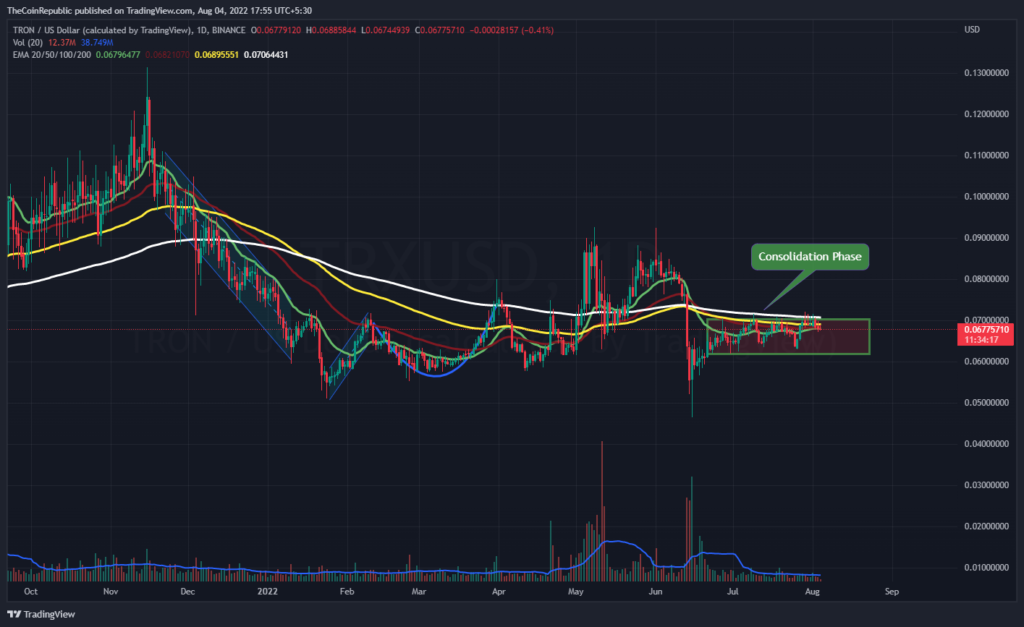
The TRX coin price is striving to exit the range-bound area on the daily price chart. The token’s price is rising, and it’s determined to break the trend. TRX coin’s price has been holding steady between $0.061 and $0.070. To move TRX outside of the range, the volume shift must be greater than usual. However, bears could buck the trend and move the token away from where it is at the moment.
Will TRX Break out of the Consolidation Phase?
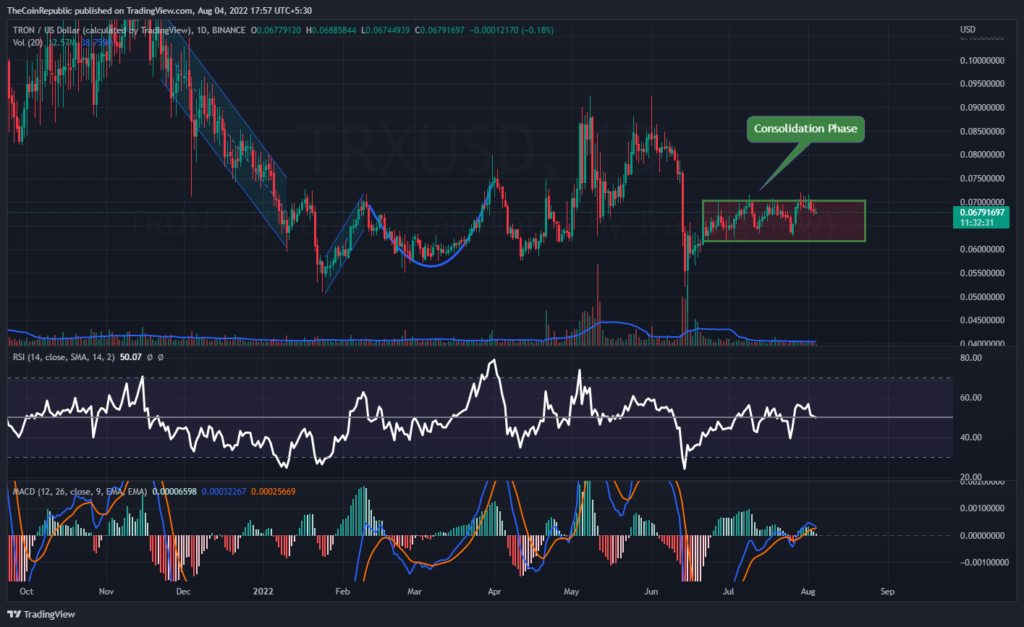
On the daily price chart, the price of TRX is attempting to climb toward the upper trendline of the consolidation phase. The cryptocurrency needs to gain strong bullish momentum and soar over the range-bound region. Technical Indicators suggest the downtrend momentum of the TRX coin.
The relative Strength Index showcases the downtrend momentum of the TRX coin. RSI is at 49 and is heading towards the oversold territory. MACD exhibits the bearish momentum of TRX coin. The MACD line is about to cross the signal line downwards resulting in a negative crossover. TRX investors need to wait for any directional change over the daily chart.
Conclusion
The price of Tron underwent a number of notable adjustments throughout the course of one day. On the daily chart, the cryptocurrency originally entered a downward channel before attempting to reverse direction inside a nearby ascending channel. Then, another correction happened as TRX entered a pattern known as a rounding bottom. During this time, the token went on an interesting roller-coaster ride. To move TRX outside of the range, the volume shift must be greater than usual. However, bears could buck the trend and move the token away from where it is at the moment. Technical Indicators suggest the downtrend momentum of TRX coin. The MACD line is about to cross the signal line downwards resulting in a negative crossover. TRX investors need to wait for any directional change over the daily chart.
Technical Levels
Support Level: $0.065 and $0.060
Resistance Level: $0.070 and $0.071
Disclaimer
The views and opinions stated by the author, or any people named in this article, are for informational ideas only, and they do not establish the financial, investment, or other advice. Investing in or trading crypto assets comes with a risk of financial loss.

Nancy J. Allen is a crypto enthusiast, with a major in macroeconomics and minor in business statistics. She believes that cryptocurrencies inspire people to be their own banks, and step aside from traditional monetary exchange systems. She is also intrigued by blockchain technology and its functioning. She frequently researches, and posts content on the top altcoins, their theoretical working principles and technical price predictions.


