
 Home
Home News
News

- The LTC price is hovering above the previous important supply zone after breaking it.
- The coin price is forming a flag and pole pattern for a 4-hour time frame.
- The pair of LTC/BTC is trading at the price of 0.002652 with an increase of 1.75% in the past 24 hours.
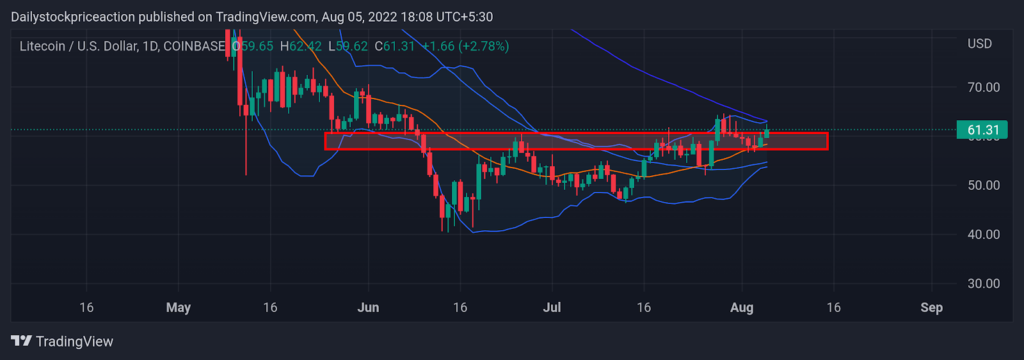
The LTC price, as per the price action, is super bullish as seen in the daily time frame. The coin price is now resting at the long-term supply zone turned demand zone after breaking it. The coin price broke the supply zone with a strong bullish candlestick pattern, confirming the breakout. As the coin price rests at the demand zone, it has started forming a bullish candlestick pattern. The coin price has started forming higher high and higher low formation on the daily timeframe. As of now, the coin price is trading at the middle of the Bollinger band indicator, after facing rejection from the upper band. The LTC coin price is currently trading above the 14 SMA and 50 MA. Therefore going forward the coin price can take support at these MA, which could result in a strong bounce. Despite the bullish momentum the coin price is yet to break the 100 MA and therefore the coin price can face strong rejection of the 100 MA moving upwards.

Volumes have increased causing the volatility to increase. The investor should remain cautious and wait for a proper signal.

ALSO READ – South Korean Banks On Radar As Regulator Investigates Kimchi Premium Bitcoin ‘Irregularities’
The LTC price is forming a flag and pole pattern on a daily time frame
Average Directional Movement Index: ADX curve has been dipping on a higher time frame as the coin continues to fall. In a daily time frame, the ADX curve has dipped out of the 20 mark and has turned upwards. As the coin price rests at the short-term demand zone on a 4-hour time frame. It is a positive sign for the coin price. Investors should wait for a positive candle formation at the demand zone.
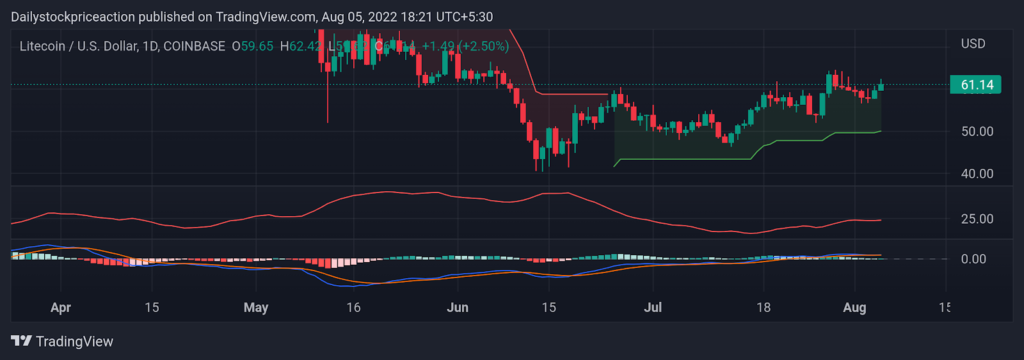
Moving Average Convergence Divergence: MACD indicator is showing bullish momentum as the coin price broke the supply zone. The coin price broke the supply zone and as a result, the MACD lines gave a positive crossover. The blue line crossed the orange line on the upside suggesting a bullish move in the upcoming days. Once the coin price breaks the flag and pole pattern, the MACD lines can be seen widening, supporting the trend.
Supertrend: Supertrend indicator is positive as the coin price broke the important small-term supply zone on the daily timeframe. Since then the coin price has failed to give a breakout of the supply zone in a larger time frame. As of now, the coin price has broken the super trend sell line which has triggered a buy line.
CONCLUSION: LTC coin price is in a strong uptrend and the same is depicted in the chart. The technical parameters suggest the same. It remains to see if the coin price will break out of the flag and pole pattern or fail to do so. Investors should wait for a clear trend and then act accordingly.
SUPPORT: $50 and $52
RESISTANCE: $61 and $63

Andrew is a blockchain developer who developed his interest in cryptocurrencies while pursuing his post-graduation major in blockchain development. He is a keen observer of details and shares his passion for writing, along with coding. His backend knowledge about blockchain helps him give a unique perspective to his writing skills, and a reliable craft at explaining the concepts such as blockchain programming, languages and token minting. He also frequently shares technical details and performance indicators of ICOs and IDOs.


