
 Home
Home News
News

- XMR token price has been on a rise following the overall bullishness in the cryptocurrency market.
- The XMR token price was trading in a range on a daily time frame, before breaking out of it, as a result it has formed a flag and pole pattern.
- The pair of XMR/BTC is trading at the price level of 0.006825 with a decrease of 1.79% in the last 24 hours.
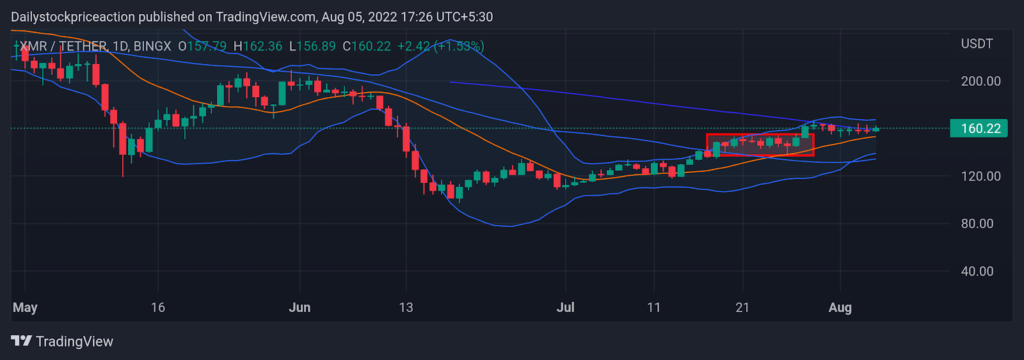
The XMR token price, as per the price action, is super bullish as it broke out of the small range after a long consolidation. As of now, the token price is resting at the long-term demand zone. XMR token price is now resting at the breakout zone and therefore a bullish candlestick formation at the demand zone can trigger bullish moves in upcoming days. As of now, the token is trading above the 50 Moving Average and 14 Simple Moving Average. Therefore moving forward the token price can be seen taking support at their Moving Averages. The XMR token price broke the supply zone with the strong bullish candlestick pattern, confirming the breakout. The XMR token price is currently trading below the upper band of the Bollinger band indicator after facing rejection. Despite the breakout, the token price is yet to cross the 100 Moving Average and therefore the investors should remain cautious as moving upwards the token price can face strong rejection.

The XMR token price is forming flag and pole pattern on a daily time frame
Relative Strength Index: RSI curve is trading at the price of 59.72 as the token nears the supply area on an hourly time frame. At present, the RSI curve is yet to cross the 20 SMA. The token is forming higher low and higher high formation on a daily time frame as the token shows bullishness in the higher time frame. The XMR token price can be seen moving when it breaks out of the small range and the RSI curve moves higher.

ALSO READ – South Korean Banks On Radar As Regulator Investigates Kimchi Premium Bitcoin ‘Irregularities’
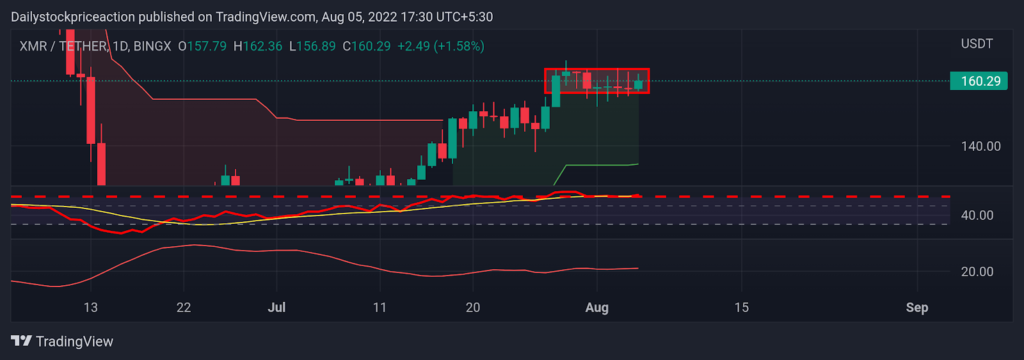
Supertrend: The XMR token price rose above the supply zone with a strong bullish candlestick pattern. The token broke out of the super trend sell line which triggered the buy signal. As of now the XMR token is trading above the super trend buy signal line. Going forward this line could act as a strong support zone.
Average Directional Movement Index: ADX curve has dipped out of the 25 mark as the token price gave a breakout of an important supply zone. As of now the ADX curve is facing upwards and is gradually increasing. This is a positive sign for the XMR token price. There can be more bullish momentum in the upcoming days as the ADX curve suggests. Before the recent breakout, the ADX curve slipped below the mark of 20.
CONCLUSION: The XMR token price is bullish as the price action suggests. On a daily time frame, the token price is seen resting at the demand zone. The technical parameters also suggest a bullish move in the price of the XMR token price. It remains to see if the XMR token price will break out of the small range supply zone on an hourly time frame or fails to do so.
SUPPORT: $145 and $148
RESISTANCE: $162 and $165

Andrew is a blockchain developer who developed his interest in cryptocurrencies while pursuing his post-graduation major in blockchain development. He is a keen observer of details and shares his passion for writing, along with coding. His backend knowledge about blockchain helps him give a unique perspective to his writing skills, and a reliable craft at explaining the concepts such as blockchain programming, languages and token minting. He also frequently shares technical details and performance indicators of ICOs and IDOs.


