
 Home
Home News
News

- Harmony (ONE) is trading into the symmetrical triangle pattern over the daily price scale.
- The ONE coin may give an extremely bullish momentum if bulls pump coins above the resistance line.
- The Harmony coin along with the Bitcoin pair is up by 4.6% at 0.00000105 Satoshis.
Above the last swing low, the Harmony (ONE) coin is showing a slightly positive trend. On the daily price chart, the One coin appears to be under a symmetrical triangular formation. The triangular pattern’s range is steadily getting smaller, and another breakout could happen. Consequently, altcoins have been showing an upward trend lately.

The Triangle pattern’s range is gradually getting less. Speculators might anticipate a sudden breakout or breakdown. After seeing a 2022 bottom level, bulls will likely try to reclaim their hegemony over cryptocurrency. Buyers frequently have a crucial support level close to an ascending trendline when the market is in an uptrend (below the chart).

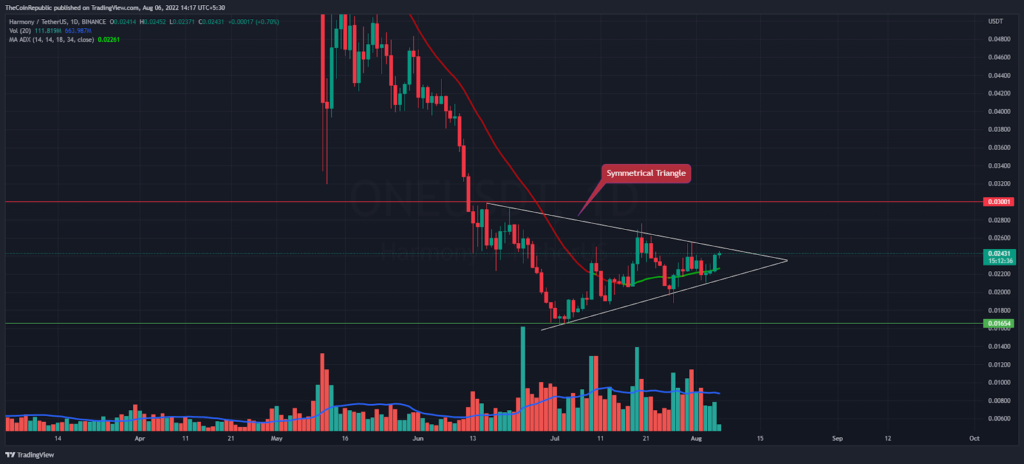
Last week buyers observed a Long-Legged Doji candle over the weekly time frame; thus, this week, the Harmony coin is up 7.2% inside the previous weekly candle. Meanwhile, the altcoin is well above the Green zone of MA ADX indicator, which is a clear sign of bullishness in the coin.
The Market Cap has finally increased above $300 Million as it’s up by 4.9% in the last 24 hours as per the CMC. However, Trading volume is low to break this triangle pattern’s range to the upside. Even then, the Harmony coin along with the Bitcoin pair is up by 4.6% at 0.00000105 Satoshis.
Would You Buy ONE Coin if Breakout Occurs?
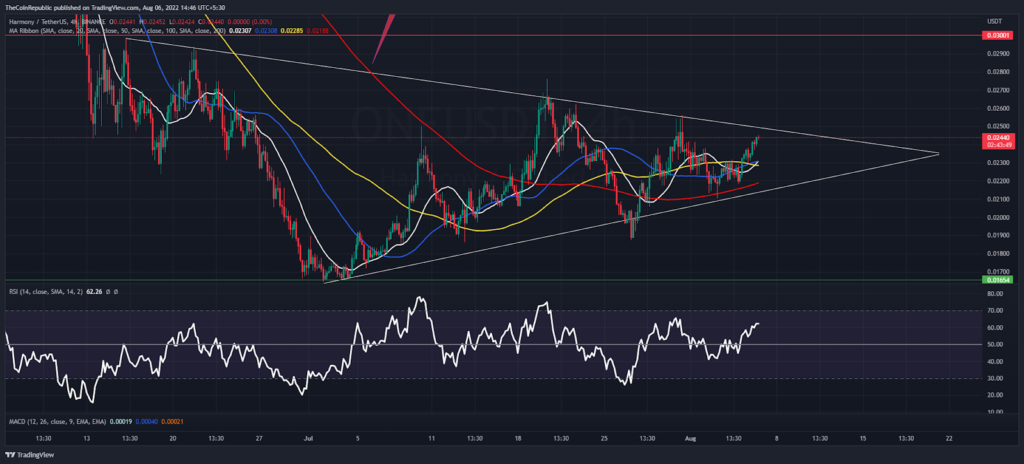
In the 4 hours time frame, buyers seem to be offensive as ONE coin is above the significant moving averages like 20,50,100, and 200. On behalf of DMA indicators, buyers may break this horizontal range ahead.
Similarly, the RSI indicator was above the semi-line, which was the key trend-changing zone.
Conclusion
Although the Harmony (ONE) coin is under the Symmetrical triangle pattern, the altcoin is still bullish. The RSI indicator suggests an uptrend for the altcoin, and a bullish breakout may occur soon above the resistance trendline.
Support level – $0.020 and $0.016
Resistance level – $0.026 and $0.030
Disclaimer
The views and opinions stated by the author, or any people named in this article, are for informational ideas only. They do not establish financial, investment, or other advice. Investing in or trading crypto assets comes with a risk of financial loss.

Nancy J. Allen is a crypto enthusiast, with a major in macroeconomics and minor in business statistics. She believes that cryptocurrencies inspire people to be their own banks, and step aside from traditional monetary exchange systems. She is also intrigued by blockchain technology and its functioning. She frequently researches, and posts content on the top altcoins, their theoretical working principles and technical price predictions.


