
 Home
Home News
News

- IIOTA coin is on the way to register the 60 days new high
- Recently the MIOTA coin moved above the 100-day moving average over the daily price scale.
- The Market Cap is increasing gradually and reached $949 Million with a 1.8% gain.
The IOTA (MIOTA) coin completed its consolidation phase a few weeks before. The altcoin trend outlook is slightly bullish as buyers follow the buy-on-dip strategy. Since 26 July, the price of altcoin has continued moving higher while it noted a 45-days high at $0.3465 Mark.

The IOTA coin registered a bullish hammer candle near the 2022 bottom, leading to the ongoing bullish trend so far. Although in the weekly time frame, buyers continue seeing bullish weekends for the past three weeks. Thus, the coin is up by 7.8% this week, while it is trading at $0.3416 Mark at the time of writing.

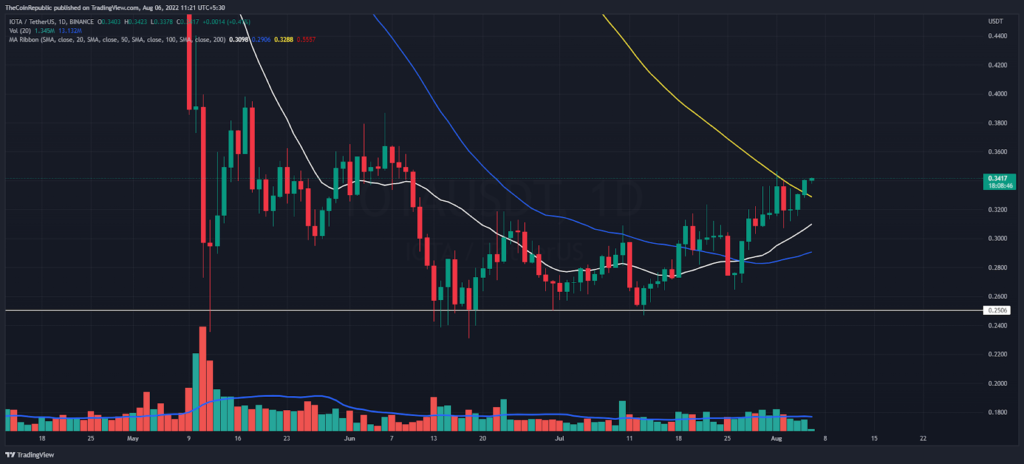
This week, speculators saw highly volatile trading sessions near below the 100-day moving average. IOTA’s market cap will be $1 Billion after a long time. Although, it’s remaining at $951 Million as per the CMC, with a 1.8% gain in the last hours.
Against the bullish trend, the trading volume is dropping because buyers struggled below the 100 DMA. Last night buyers successfully got their dominance as they maintained the IOTA coin above the 100-DMA (the zone of volatility). Now it’s turned into an immediate support zone for buyers.
RSI Reached at Key Bullish Hurdle on Weekly Time Frame
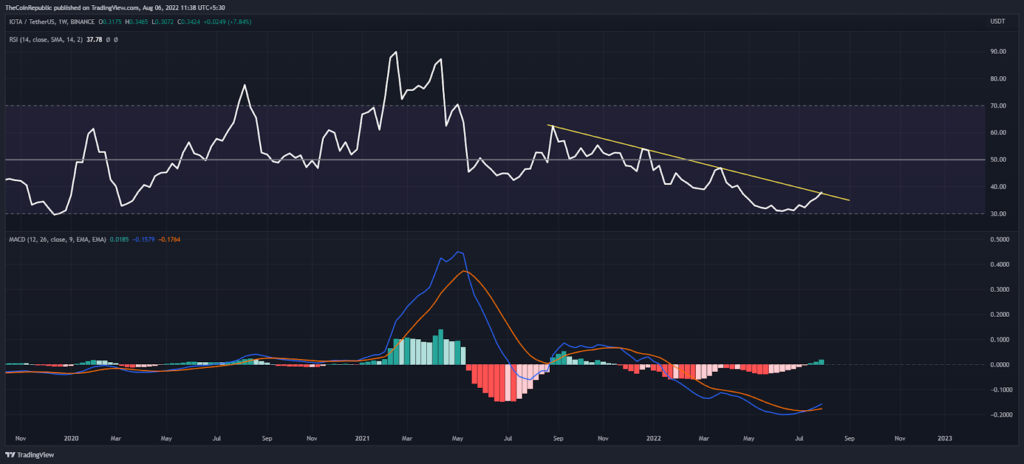
In the course of the weekly price scale, the RSI indicator recovers from the oversold territory with a curve pattern. Now the RSI indicator is approaching a bearish trendline (yellow). Similarly, the MACD suggests bullishness for the MIOTA coin as it generates a bullish crossover in the negative region.
Conclusion
Traditional indicators like RSI and MACD recommend the bullishness of IOTA Coin for a long-term view. Buyers also seem to be bullish for the propelling of price trend ahead towards the latest 60 Days high.
Support levels- $0.30 and $0.25
Resistance levels- $0.40 and $0.70
Disclaimer
The views and opinions stated by the author, or any people named in this article, are for informational ideas only, and they do not establish the financial, investment, or other advice. Investing in or trading crypto assets comes with a risk of financial loss.

Andrew is a blockchain developer who developed his interest in cryptocurrencies while pursuing his post-graduation major in blockchain development. He is a keen observer of details and shares his passion for writing, along with coding. His backend knowledge about blockchain helps him give a unique perspective to his writing skills, and a reliable craft at explaining the concepts such as blockchain programming, languages and token minting. He also frequently shares technical details and performance indicators of ICOs and IDOs.


