
 Home
Home News
News

- MKR token price is trading above the supply zone after breaking it with strong bullish pressure.
- The MKR token price has broken the inverted head and shoulder pattern on a daily time frame.
- The pair of MKR/BTC is trading at the price of 0.0481 with an increase of 2.4% in the past 24 hours.
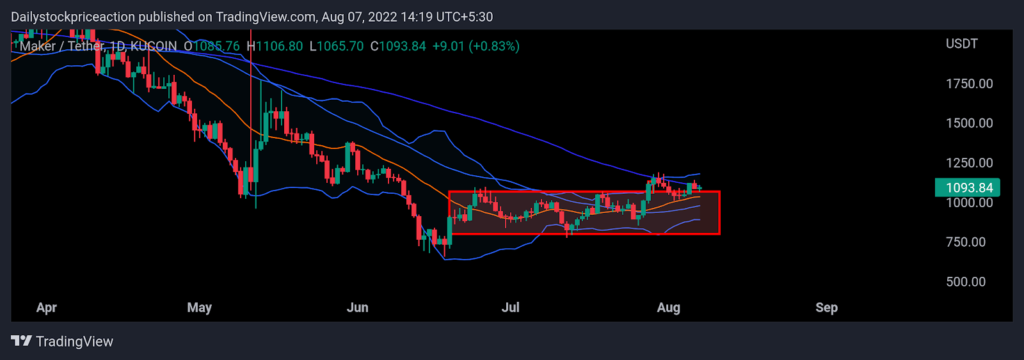
The MKR token price is trading at the uptrend on a daily time frame as it broke the supply zone. The MKR token price also broke the inverted head and shoulder pattern. As it broke the supply zone, the token price can be expected to continue the bullish momentum in the upcoming days. The token price has started making higher high and higher low formations on the daily time frame, confirming the bullish trend for at least the short term. The MKR token price has broken the supply zone with a strong bullish candlestick formation. As of now, the MKR token has fallen after breaking and as a result, the MKR price is seen retesting the breakout zone. The MKR token price has broken the 14 SMA and 50 MA following the bullish trend. Moving forward the token price can be seen resting at these MAs. Despite the bullishness in the price of the MKR token, it is yet to break the 100 MA and therefore moving upwards the price can be seen facing rejection. At present, the MKR token price is resting in the middle of the Bollinger band indicator after failing to surpass the upper band. Volumes have increased due to the breakout of the supply zone. As a result, there is an increase in volatility.

The MKR token price is forming a flag and pole pattern on a four-hour time frame
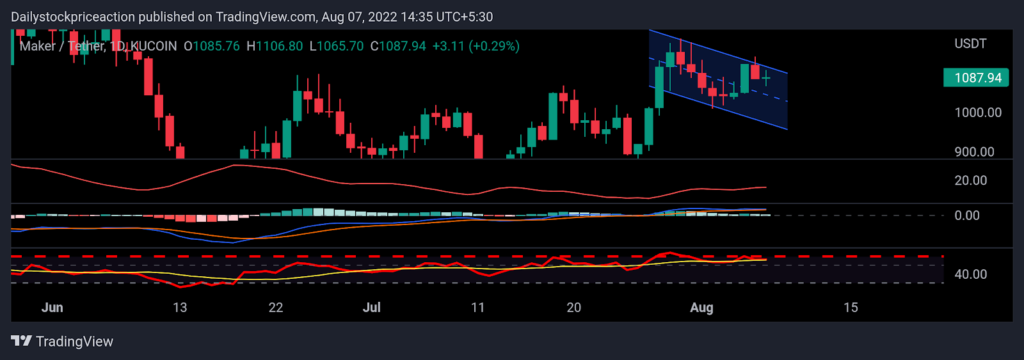
Average Directional Movement Index: ADX curve has been dipping on a higher time frame as the token continues to fall. In an hourly time frame, the ADX curve has dipped out of the 20 mark and has turned upwards. As seen in the 4-hour time frame the ADX curve has risen above the zone indicating strong bullishness. As the token price hovers around the supply zone, the ADX curve is still pointed upside. Investors should wait for a breakout of the supply zone with a positive candle formation.

Relative Strength Index: RSI curve is trading at the level of 61.75. The RSI curve has crossed the halfway mark of 50. Once the token crosses the supply zone of 0.45 the token price can be seen moving up with strong bullish momentum. The RSI curve has crossed the 20 EMA yellow line indicating a short-term bullishness. As RSI nears the 70 mark it could be problematic for the MKR token price as it might move into the overbought zone.
Moving Average Convergence Divergence: MACD indicator has given a positive crossover as the token price broke the supply zone. The MKR token has gone past the supply zone as the MACD depicted where the blue line crossed the
orange line on the upside supporting the bullish breakout. Once the token retest successfully, the MACD lines can be seen widening confirming the retest and further up move.
CONCLUSION: The MKR token price is trading at the breakout zone after breaking the important supply zone. As of now, the token price is resting at the demand zone doing a retest. It remains to see if the token price will bounce back or fail to do so and deny the breakout.
SUPPORT: $1000.00 and $1010.00
RESISTANCE: $990.00 and $985.00
Disclaimer
The views and opinions stated by the author, or any people named in this article, are for informational ideas only. They do not establish the financial, investment, or other advice. Investing in or trading crypto assets comes with a risk of financial loss

With a background in journalism, Ritika Sharma has worked with many reputed media firms focusing on general news such as politics and crime. She joined The Coin Republic as a reporter for crypto, and found a great passion for cryptocurrency, Web3, NFTs and other digital assets. She spends a lot of time researching and delving deeper into these concepts around the clock, and is a strong advocate for women in STEM.


