
 Home
Home News
News

- Zilliqa price is trading with downtrend momentum inside the consolidation phase over the daily chart.
- ZIL crypto is trading above 20 and 50 EMA but still behind 100 and 200-days Daily Moving Average.
- The pair of ZIL/BTC is at 0.000001968 BTC with an intraday drop of 1.63%.
The cost of Zilliqa has remained stable inside the horizontal range-bound region ever since June 27. The token has been attempting to exit the consolidation phase, but bulls have consistently failed to retain gains at the consolidation phase’s threshold. Bullish sentiment in ZIL suggests that they are focused on documenting the token’s breakthrough from the horizontal range this time. Nevertheless, the token’s price has been holding steady between $0.034 and $0.050. ZIL’s price is currently in a strong uptrend and climbing into the top range of the consolidation period. ZIL bulls must keep their position at the trendline in order to allow the token to rise above the caged region.

The estimated price of Zilliqa is currently $0.045; in terms of market cap, it dropped by 2.11 percent the day before. The volume of trades during the intraday trading session dropped by 61.40 percent. This may indicate that bears are attempting to stockpile ahead of the price collapse of ZIL cryptocurrency. Volume to market cap ratio is 0.2647.

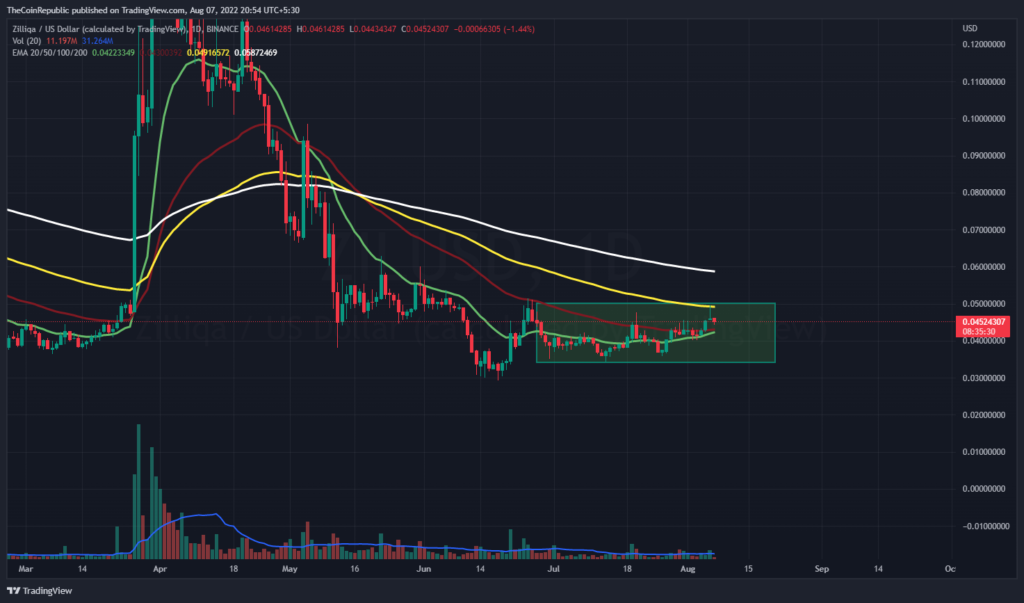
ZIL’s price is making an ascent toward the consolidation phase’s upper trendline on the daily price chart. Bulls must assemble at ZIL to watch the breakout of the token. However, given that volume shows that the rate of accumulation is minimal, bears could halt the ZIL coin’s positive momentum at any point. Bulls in ZIL must accumulate rapidly if they are to avoid falling into any bearish traps.
ALSO READ – MAKER Token Price Analysis: MKR token has finally broken out of the supply zone, will it sustain above it?
What do Technical Indicators suggest about ZIL?
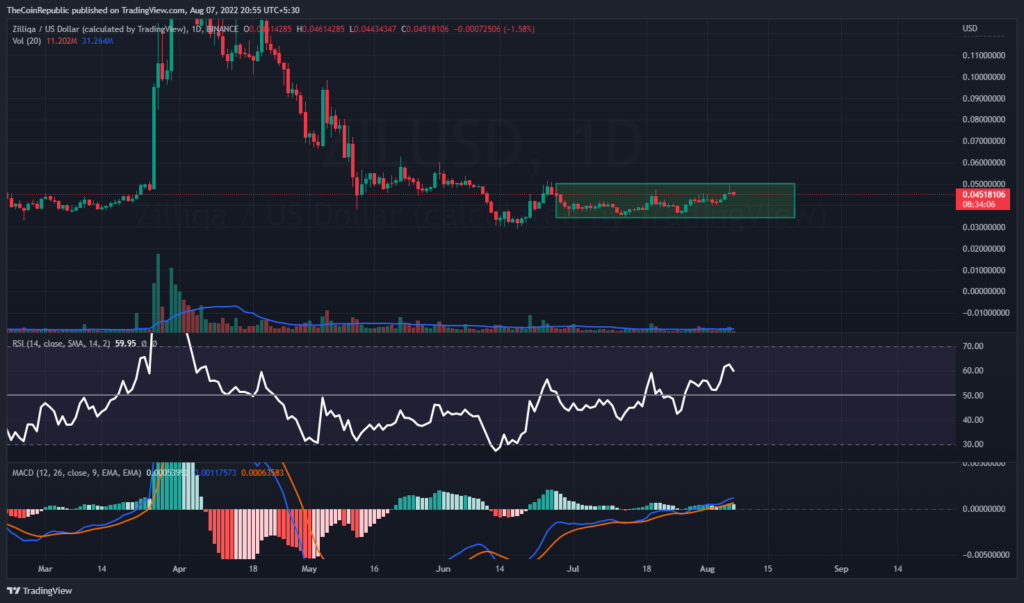
ZIL coin price is trying to sustain at the current level inside the consolidation phase over the daily chart. Technical indicators suggest the downtrend momentum of ZIL coin.
Relative Strength Index showcases the downtrend momentum of ZIL coin. RSI is at 60 and heading towards neutrality. MACD exhibits the bearish momentum of the ZIL coin. The MACD line is approaching the signal line for a negative crossover. ZIL investors need to wait for any directional change over the daily chart.
Conclusion
The cost of Zilliqa has remained stable inside the horizontal range-bound region ever since June 27. The token has been attempting to exit the consolidation phase, but bulls have consistently failed to retain gains at the consolidation phase’s threshold. Bullish sentiment in ZIL suggests that they are focused on documenting the token’s breakthrough from the horizontal range this time. Nevertheless, the token’s price has been holding steady between $0.034 and $0.050. However, given that volume shows that the rate of accumulation is minimal, bears could halt the ZIL coin’s positive momentum at any point. Technical indicators suggest the downtrend momentum of ZIL coin.
Technical Levels
Support Levels: $0.040
Resistance Levels: $0.050
Disclaimer
The views and opinions stated by the author, or any people named in this article, are for informational ideas only, and they do not establish the financial, investment, or other advice. Investing in or trading crypto assets comes with a risk of financial loss.
Steve Anderson is an Australian crypto enthusiast. He is a specialist in management and trading for over 5 years. Steve has worked as a crypto trader, he loves learning about decentralisation, understanding the true potential of the blockchain.


