
 Home
Home News
News

- The bulls and bears are trying to play tug of war over the price of WAVE
- The WAVES Inu has dropped by approx 10 % in the last 24 hours and the current price is around
- The pair of WAVES/BTC is at 0.000000000487 BTC and has inclined by 6.20%
WAVE’s volatile price can bring some fatal circumstances for both bulls and bears. The WAVES price is being pushed so hard by both bulls and bears to reach the desired targets. Investors find it challenging to predict the right movement of the Shib due to the fluctuating price range on the daily price chart. The coin has the potential to increase, but the bearish trend is preventing that from happening. And the bulls are also putting a lot of pressure this is going to be interesting to analyze the market over this crucial battle.

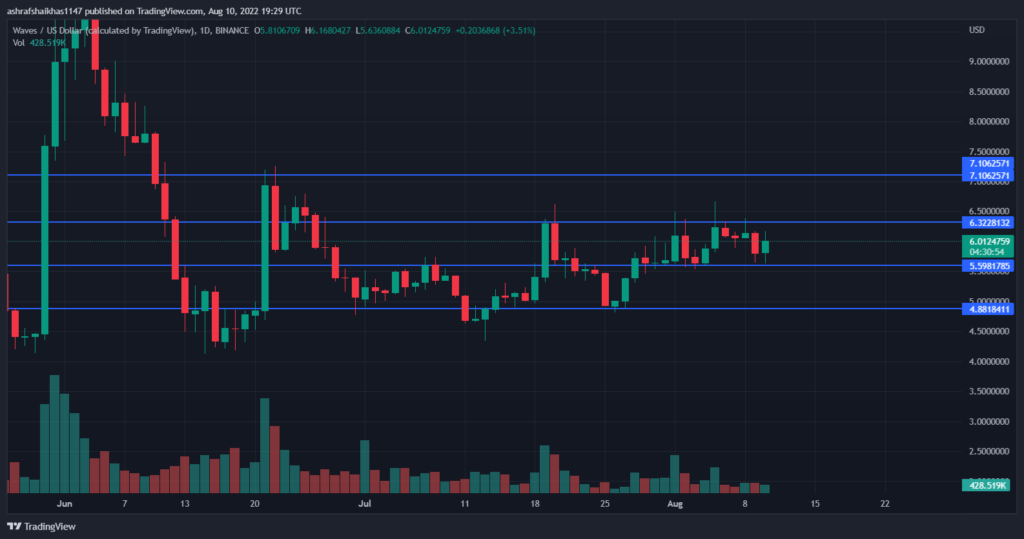
The price of WAVES is currently around $6.02 and has increased by nearly 3.96% during the intraday trading session. The WAVES/BTC pair is currently inclined by approx 1.37%, trading at about 0.0002543 BTC. The price may approach the primary support level of about $5.5981. If the bulls do not respond, the bears will be able to easily push the WAVES price to its secondary support of $4.8818.The price gain shows that buyers are getting in the action, as the price is approaching the primary resistance of $6.3228 and if the bull’s strategies work the price may reach to secondary resistance of $7.1062

Bulls and bears are battling with one another to manipulate the market. The bulls are attempting to push the WAVES upward, but the bearish trend is pulling it back down, which is confusing for the investors significantly. The volume of the WAVES has decreased by about 0.48%. This indicates that bears are trying to enter the trade. If the bears take it with pinch of salt then it could be a fatal defeat for the bulls. we will see who wins, bulls or bears. The volume to market cap ratio for WAVES is 0.3952. To match the expectations of investors, the bears must push themselves. Because the bulls are seeking to smash the bears, the bears will have a difficult time developing a solid market for WAVES.
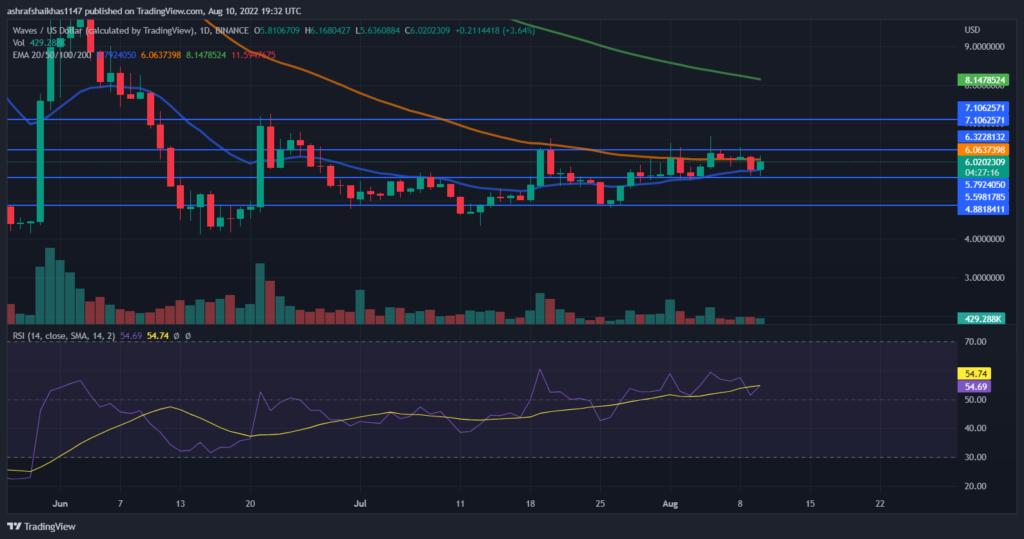
The technical indicator shows the following: The Relative Strength Index is approaching overbought territory. The current RSI is 54.79 which is above the average RSI of 54.74. The bulls worked hard to get the RSI to the overbought zone. However, the stillness of the bears is an advantage for the bulls to prepare for their desired goals and pushed the RSI into the overbought zone. The bears have to go some extra miles to normalize the RSI. The coins price remains above the 20,50 Exponential moving and is still lagging behind the 100,200 Daily Moving Average.
Technical Levels
Support Levels:$5.5981 and $4.8818
Resistance Levels: $6.3228 and $7.1062
Disclaimer
The views and opinions stated by the author, or any people named in this article, are for informational ideas only. They do not establish the financial, investment, or other advice. Investing in or trading crypto assets comes with a risk of financial loss.

With a background in journalism, Ritika Sharma has worked with many reputed media firms focusing on general news such as politics and crime. She joined The Coin Republic as a reporter for crypto, and found a great passion for cryptocurrency, Web3, NFTs and other digital assets. She spends a lot of time researching and delving deeper into these concepts around the clock, and is a strong advocate for women in STEM.


