
 Home
Home News
News

- The BCH price had an abrupt spike after breaking out of a parallel range, which is presently being followed by a significant downtrend movement on the daily price chart.
- The technical indicators support the bearish movement over the hourly chart which shows the chances of a comeback are very less.
- The BCH/BTC pair is at 0.005944 BTC which is at a loss of 0.98%.
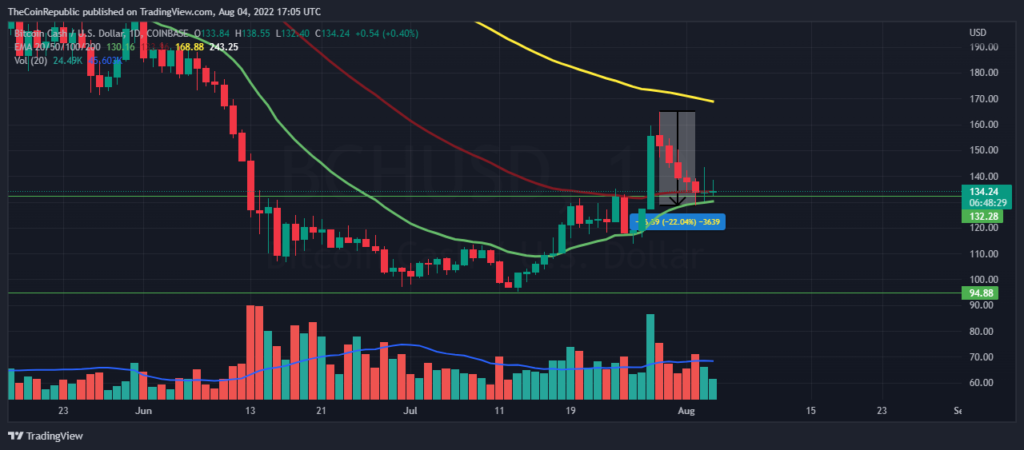
After breaking a parallel range the BCH price got an abrupt increase which is now followed by a strong downtrend movement over the daily price chart. The movement is largely dominated by the traditional cryptocurrency Bitcoin, this signifies the extent of bearishness over the market. Now the bulls should accumulate to rescue the coin.

The BCH price sank approx. 22% in 5 days and is still falling as the bears are now ready to loosen their grip over the market. If bulls didn’t come forward to help then it will be a tough situation for everyone, as many investors are facing huge losses. The trading volume is still at a gain of 38% which makes the investors calm in this alarming situation.

The current price for one BCH coin is trading at $133.74 which is a decrease of 4.19% in its market capitalization in the last 24 hrs. The coin has a trading volume of 354 million which is currently at a massive gain of 38.07% in the 24 hrs trading session and a market cap of 2.56 billion. The volume market cap ratio for BCH is 0.1354.
Can BCH Make a Bounce Back?
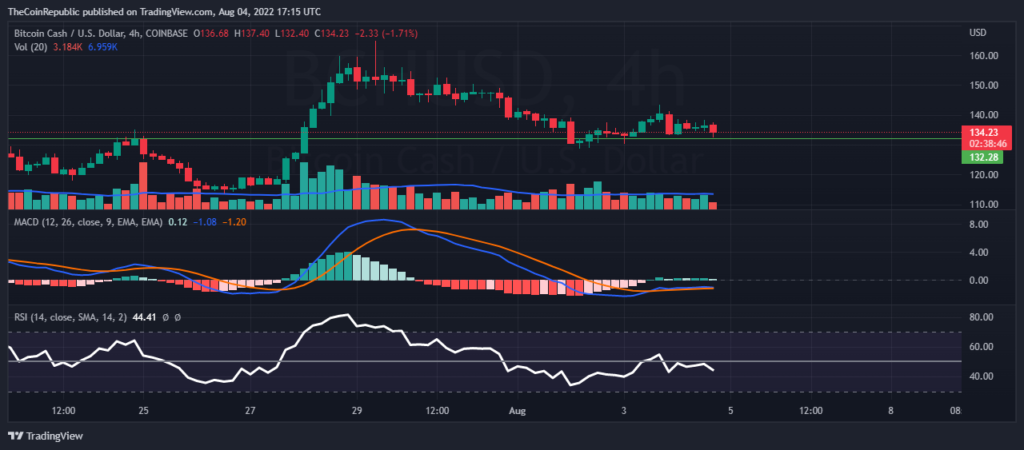
While analyzing the short-term (4 hrs) chart we can observe a flattering movement over which the bears are dominating. This shows that domination is spread across all time horizons.
The MACD indicator over the hourly chart shows the buyers’ line is approaching the seller’s signal line from above. If the same situation persists we can witness a negative cross which is also supported by the histograms. The relative strength index indicates the increase in selling pressure which is causing the RSI to fall. The RSI value is nearly equal to 45. So it looks difficult for the BCH price to make bounce back.
Conclusion
After breaking a parallel range the BCH price got an abrupt increase which is now followed by a strong downtrend movement over the daily price chart. The BCH price sank approx. 22% in 5 days and is still falling. The trading volume is still at a gain of 38% which makes the investors calm in this alarming situation. While it looks difficult for the BCH price to make a bounce back as the technical indicators appear to be in favor of bears currently.
Technical levels
Resistance levels: $164.8 and $188.8
Support levels: $128.31 and $ $118
Disclaimer
The views and opinions stated by the author, or any people named in this article, are for informational ideas only, and they do not establish the financial, investment, or other advice. Investing in or trading crypto assets comes with a risk of financial loss.

Nancy J. Allen is a crypto enthusiast, with a major in macroeconomics and minor in business statistics. She believes that cryptocurrencies inspire people to be their own banks, and step aside from traditional monetary exchange systems. She is also intrigued by blockchain technology and its functioning. She frequently researches, and posts content on the top altcoins, their theoretical working principles and technical price predictions.


