
 Home
Home News
News

- The coin has started following the upward curve creating an opportunity for investors to book a huge profit
- The current price of the coin is around $1.23 and has raised approx 3.85% during the intraday trading session
- The pair of EOS/BTC is surfing around 0.00005337BTC and has increased by 3.44% in the last 24 hours
The coin has started to follow an upward trend. It appears that the coin price is heading towards the bull’s targeted zone. The bulls have come up with a new strategy to break the bullish trend and now the bears have got weaker now the bulls have taken over the market of the EOS. Due to this bullish trend, the whales could move. The movement of whales could bring a drastic change to the daily price chart. The bulls have to be more concerned as the bears may try to enter the trade and manipulate the price of the coin.

The current price of EOS is surfing around $1.23 and has raised approx 3.85% during the intraday trading session. The pair of EOS/BTC is around 0.00005337BTC and has increased by 3.44% in the last 24 hours. The bears must act immediately. As the bulls have pushed the price of the coin in their court but to bring the price back to the bear’s court the bears have tried to enter the trade but bulls beat the bear’s plan but bears have tried to bring the price to catch some downward momentum. The bulls may take the price up to the primary resistance of $1.3251 and if the bulls succeed in their further plans and the bears will stay paused then the price may reach the secondary resistance of $$1.7026. However, if the bears finally woke up and gathered the guts, they may raise the price to the primary support level.t of $1.0366. And the price may reach up to the secondary support of approx $0.8924.

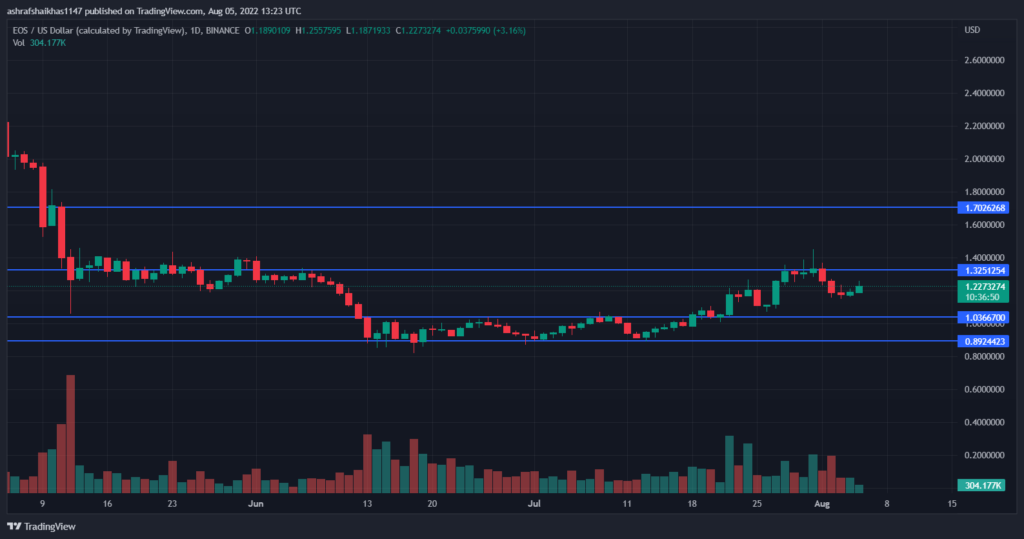
There has been an increase in the volume of almost 13.59% during the intra-day trading session. The volume has been steadily decreasing which indicates that the short-selling pressure is decreasing on the coin, and buyers are working too hard to increase the buying pressure. The bullish trend has begun to go forward as the bulls have begun to trade. The market cap to volume ratio is 0.2190.
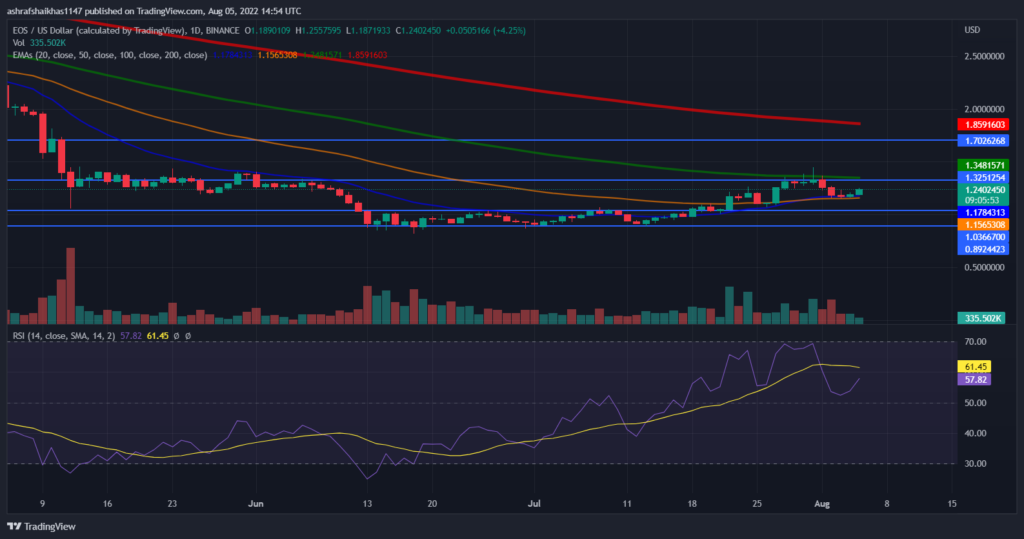
The technical indicator shows the following: The relative strength index is in the overbought zone and the buying is increasing therefore the RSI is getting more into the overbought zone. The current RSI is 57.94 which is below the average RSI. The average RSI is 61.46. The price is moving ahead of the 20,50 estimated moving average and is still lagging behind the 100,200 daily moving average. There is the wave of happiness in the investors as the bulls are carrying their hopes after the end of a bearish trend
Technical Levels
Support Levels: $1.0366 and $0.8924.
Resistance Levels: $1.3251 and $1.7026
Disclaimer
The views and opinions stated by the author, or any people named in this article, are for informational ideas only. They do not establish the financial, investment, or other advice. Investing in or trading crypto assets comes with a risk of financial loss.

Andrew is a blockchain developer who developed his interest in cryptocurrencies while pursuing his post-graduation major in blockchain development. He is a keen observer of details and shares his passion for writing, along with coding. His backend knowledge about blockchain helps him give a unique perspective to his writing skills, and a reliable craft at explaining the concepts such as blockchain programming, languages and token minting. He also frequently shares technical details and performance indicators of ICOs and IDOs.


