
 Home
Home News
News

- MKR token price has been on an uptrend after breaking the important supply zone.
- At present, the token price has formed a bullish flag and pole pattern.
- The pair of MKR/BTC Is trading at the price of 0.04630 with a decrease of -0.05% in the past 25 hours.
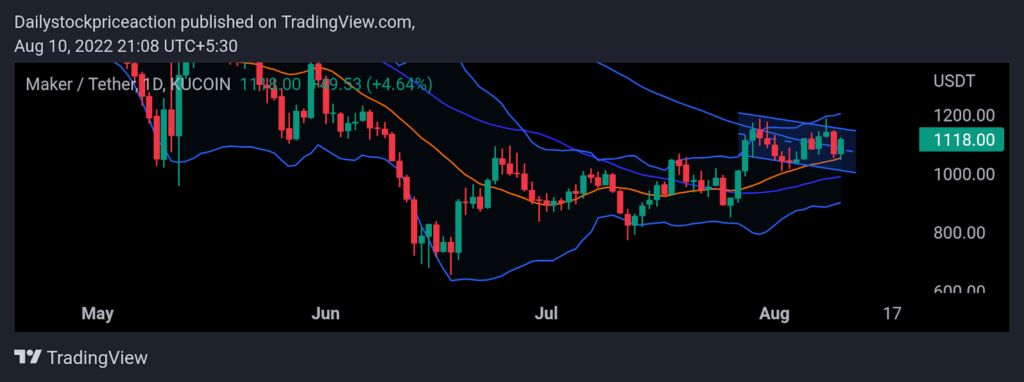
The MKR token price is bullish as it broke the inverted head and shoulder pattern on a daily time frame. After breaking the important supply zone, the MKR token price started consolidating which resulted in the formation of the bullish chart pattern. As of now, the token price has gone past every small term resistance. The MKR token price has started forming higher high and higher low price structures on a daily time frame. The MKR token price broke the important long-term supply zone with a strong bullish candlestick chart pattern. At present, the MKR token price is trading in the middle of the Bollinger band indicator after rising rapidly. Despite the bullishness in the MKR token price, it failed to surpass the upper band of the Bollinger band indicator. The MKR token price is currently trading above the 50 and 14 MA and SMA respectively after breaking them during the recent bullishness. Moving upwards the token price can be seen resting at these MAs. Despite the bullishness, the token price has failed to storm past the 100 MA and therefore moving upwards the token price can be seen facing rejection of it. Volumes have increased causing the volatility to increase therefore investors should remain cautious and wait for a proper retest of the breakout zone.

The MKR token price is forming a flag and pole pattern on a daily time frame
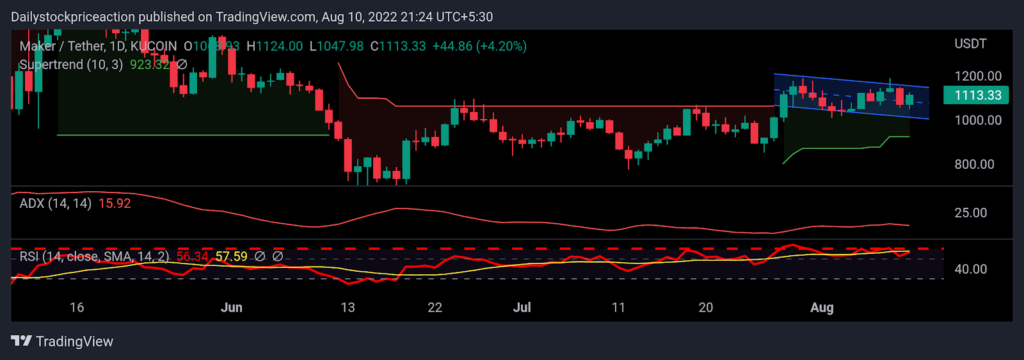
Average Directional Movement Index: ADX curve has been dipping on a higher time frame as the token continues to fall. In an hourly time frame, the ADX curve has dipped out of the 20 mark and has turned upwards. As seen in the 4-hour time frame the ADX curve has risen above the zone indicating strong bullishness. As the token price hovers around the supply zone, the ADX curve is still pointed upside. Investors should wait for a breakout of the supply zone with a positive candle formation.

Relative Strength Index: RSI curve is trading at the level of 56.34. The RSI curve has crossed the halfway mark of 50. Once the token crosses the supply zone of 1200.00 the token price can be seen moving up with strong bullish momentum. The RSI curve has crossed the 14 EMA yellow line indicating a short-term bullishness. As RSI nears the 70 mark it could be problematic for the MKR token price as it might move into the overbought zone.
Supertrend: The MKR token price has been on an upward trajectory after breaking the supply zone on a daily time frame. As a result, the token price has started making higher highs. The super trend indicator is triggering a buy signal as the MKR token price broke the supply zone way back. Moving forward the token price can be seen resting at the super trend by line. A bearish move can trigger when the token price breaks the super trend by line.
CONCLUSION: MKR token price has been on an upwards trajectory and the same is depicted by the technical parameters on a daily time frame. As of now, the token price has started resting at the supply zone. MKR token price is retesting the breakout zone on a daily time frame. It remains to see if the token price breaks the flag and pole pattern on the upside or fails to do so.
SUPPORT: $1000 and $990
RESISTANCE: $1160 and $1200

Nancy J. Allen is a crypto enthusiast, with a major in macroeconomics and minor in business statistics. She believes that cryptocurrencies inspire people to be their own banks, and step aside from traditional monetary exchange systems. She is also intrigued by blockchain technology and its functioning. She frequently researches, and posts content on the top altcoins, their theoretical working principles and technical price predictions.


