
 Home
Home News
News

- MANA token price is in an uptrend after breaking the important supply zone on a daily time frame.
- The token price has formed an ascending triangle pattern in a 4-hour time frame.
- The pair of MANA/BTC Is trading at the price of 0.000044 with an increase of 0.55% in the past 24 hours.
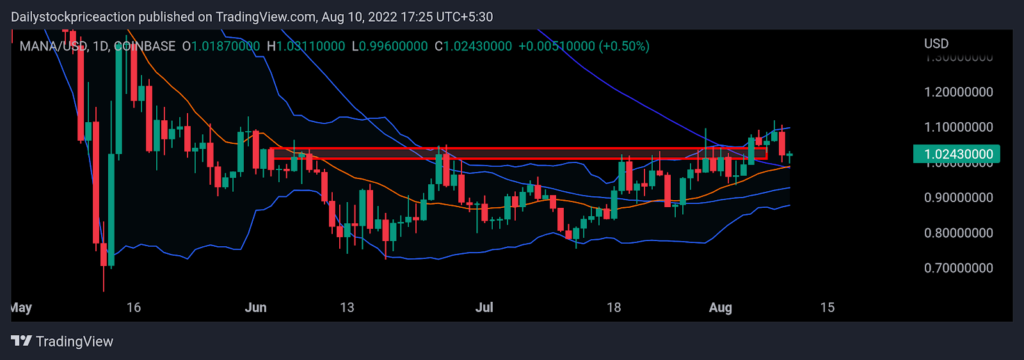
Mana token price, as per the price action has gone past the important supply zone. Currently, it is trading above the supply zone. As of now, the MANA token price has started consolidating above the breakout zone. The MANA token price can be seen resting at the breakout zone as a retest. If the token price is successfully able to retest the breakout zone, it can be seen rising higher. The token price has started forming higher high and higher low formation on a daily time frame. The breakout of the long-term supply zone was strong and therefore the price can be seen moving up after the bullish candlestick formation. The MANA token price is trading above the important 50 and 100 Moving Average. Recent breakout has led to a rapid bullish rally and therefore the token price can be seen retracing and resting at the 50 and 100 Moving Averages. The MANA token price has also gone past the 14 SMA as a result it bounced off the small-term demand zone. The token price is currently trading in the middle of the Bollinger band indicator after failing to surpass the upper band. Volumes have increased during the breakout and thus investors should wait for it to cool down and then act accordingly.

The MANA token price is forming ascending triangle pattern on a 4-hour time frame
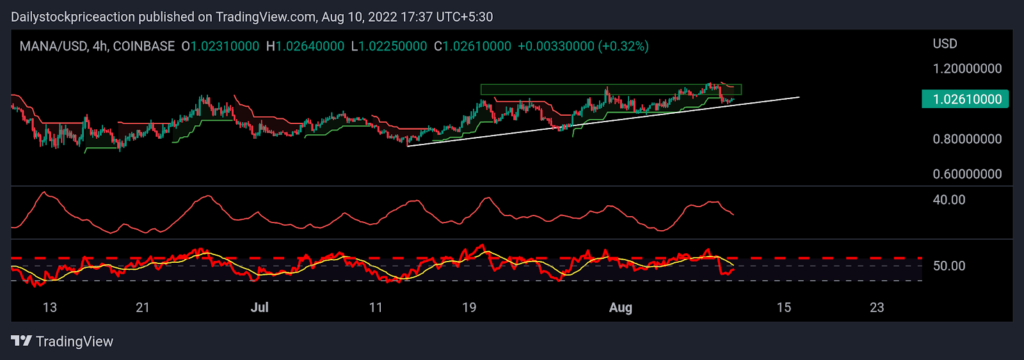
Average Directional Movement Index: ADX curve has been dipping on a weekly time frame as the token continues to fall. In an hourly time frame, the ADX curve has dipped out of the 20 mark and has turned upwards. As seen in the 4-hour time frame the ADX curve has risen above the zone indicating strong bullishness. As the token price hovers around the supply zone, the ADX curve is still pointed upside. Investors should wait for a breakout of the supply zone with a positive candle formation.

Relative Strength Index: RSI curve is trading at the level of 44.75. The RSI curve is yet to cross the halfway mark of 50. Once the token crosses the supply zone of 1.13 the token price can be seen moving up with strong bullish momentum. The RSI curve has crossed the 14 EMA yellow line indicating a short-term bullishness. Once the RSI crosses the halfway mark of 50 the MANA token price can be seen breaking the supply zone, supporting the trend.
Supertrend: The MANA token price crossed the important supply zone on a daily time frame. As a result, the token price gave a breakout of the super trend sell signal line. Since then the MANA token price has been in a strong uptrend. Moving forward the token price can be seen resting at the super trend buy line
The breakout of the supply zone was with a strong bullish candlestick pattern.
CONCLUSION: MANA token price is in a strong uptrend. Price action suggests the same as the token price breaking the important supply zone. The technical parameters are also bullish supporting the trend on a daily time frame. Investors should wait for a breakout of the ascending triangle bullish chart pattern in a 4-hour time frame.
SUPPORT: $0.80 and $0.90
RESISTANCE: $1.20 and $1.10

Andrew is a blockchain developer who developed his interest in cryptocurrencies while pursuing his post-graduation major in blockchain development. He is a keen observer of details and shares his passion for writing, along with coding. His backend knowledge about blockchain helps him give a unique perspective to his writing skills, and a reliable craft at explaining the concepts such as blockchain programming, languages and token minting. He also frequently shares technical details and performance indicators of ICOs and IDOs.


