
 Home
Home News
News

- OMG is following the bullish trend. Will it follow the upward curve or will fall down?
- The current price of OMG is surfing around
- The pair of OMG/BTC is around
The coin is following the upward curve the price of the coin has started gaining upward momentum and the price is raising and the bulls are getting the ball in their court. The bulls have pushed themselves harder this time to achieve their goals and they have succeeded in their plans. The bears have to face a lot of hurdles to drag the price over their desired zones.

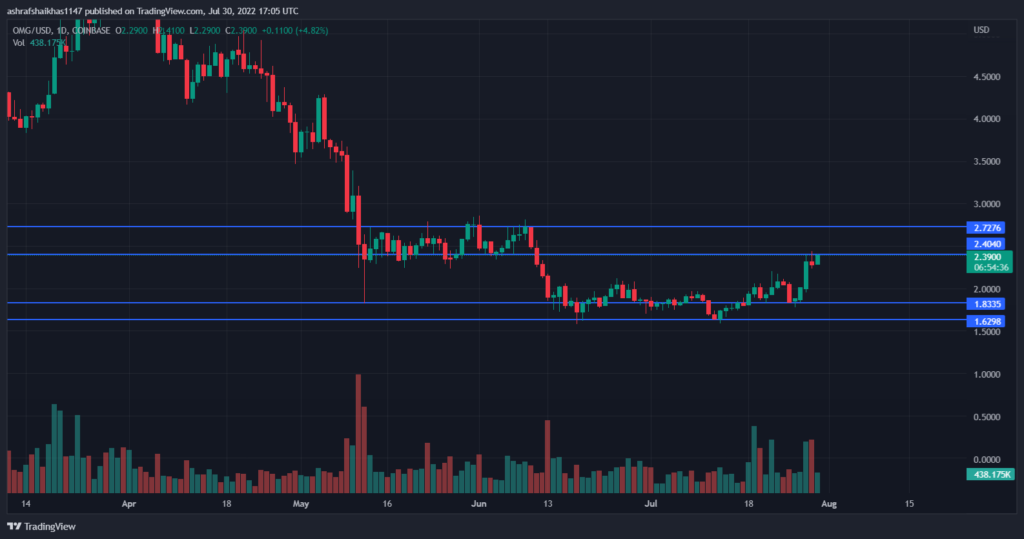
The current price of the OMG is currently around $2.73 with a total increase of 3.97% during the intraday trading session and the pair of OMG/BTC is around

0.00009668 BTC. The bears have to work hard to make tokens follow the downward trend. The bears are trying to enter the trade the bears need a window to enter the trade if the bears come up with better strategies then they may beat the bulls and may drag the price to the primary support of $1.8335 and the price may drop up to secondary support of $1.6298 if the bearish trend continues. The bulls may take the price up to the primary resistance of
$2.4040 and if the bullish trend continues the price may reach up to the secondary resistance of $2.7276.
The volume of the coin has dropped by around 36.21% the continuous drop in the volume indicates that the selling pressure has increased and the bulls must respond and enter the trade because buying is becoming weaker day by day, creating a hurdle for OMG to reach its full potential. The volume to market cap ratio is around 0.814. To achieve goals, the sellers must put more effort. Investors will choose to shift to either side. However, this will create an opportunity for new investors to enter the market.
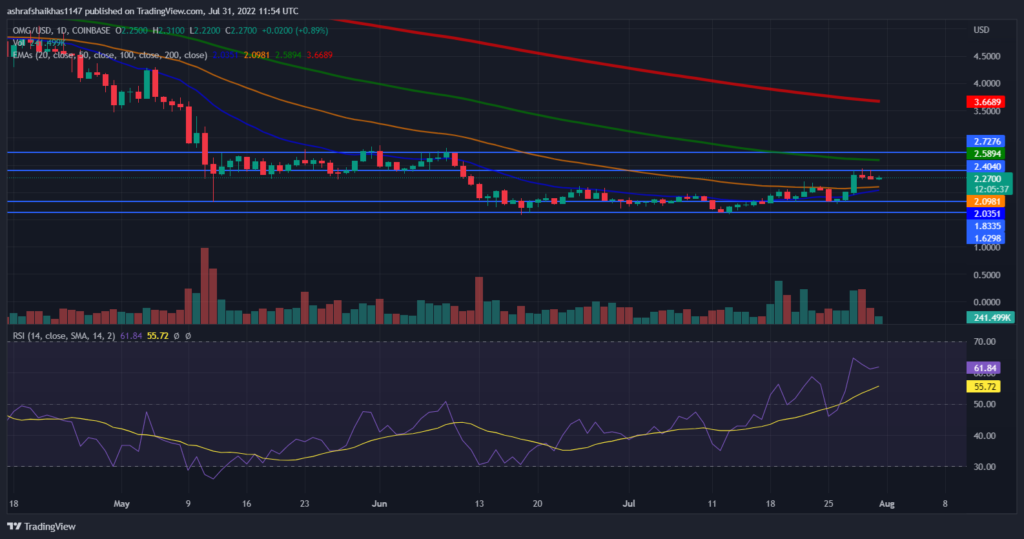
The technical indicator shows the following: The relative strength index is in the overbought zone and the buying is getting stronger the sellers have to knuckle under to normalize the price of the OMG. The current RSI is 61.84
which is above the average RSI. the average RSI is 55.75. The price is moving ahead of the 20,50 estimated moving average and is still lagging behind the 100,200 daily moving average. The investors of the OMG have to decide to move on either to make the whales move or the bulls have to work to bring upward momentum This could bring a further movement in the price of the coin.
Technical Levels
Support Levels: $1.8335 and $1.6298
Resistance Levels: $2.4040and $2.7276
Disclaimer
The views and opinions stated by the author, or any people named in this article, are for informational ideas only. They do not establish the financial, investment, or other advice. Investing in or trading crypto assets comes with a risk of financial loss.

Nancy J. Allen is a crypto enthusiast, with a major in macroeconomics and minor in business statistics. She believes that cryptocurrencies inspire people to be their own banks, and step aside from traditional monetary exchange systems. She is also intrigued by blockchain technology and its functioning. She frequently researches, and posts content on the top altcoins, their theoretical working principles and technical price predictions.


