
 Home
Home News
News

- Arweave price has been consolidating at 2021 lows over the daily price chart.
- AR crypto is trading at 20 and 50 EMA and is still below 100 and 200-days Daily Moving Average.
- The pair of AR/BTC is at 0.0006073 BTC with an intraday drop of 2.66%.
The Arweave price is trending significantly in an upbeat manner on the daily price chart. The token entered a consolidation phase on April 7th after starting to drop towards lower levels at $43. The currency is clearly moving upward as it trades towards the upper trendline, but it also seems determined to break out of the consolidation. AR investors must wait until bulls maintain their position at the edge of the region that is bound by a horizontal range. The price of the AR coin appears to be quite committed to breaking through the consolidation stage. To maintain at the top trendline of the consolidation phase, AR must increase its buyer base. The price of AR currency has been stabilizing between $10.85 and $16.50.

Arweave’s estimated price is $14.94 at the moment, and in the previous day, it lost 6.36% of its market value. The intraday trading session saw a 28.85% reduction in trade volume. This predicts that the daily chart of AR currency is experiencing short selling pressure. Volume to market cap ratio is 0.08292.

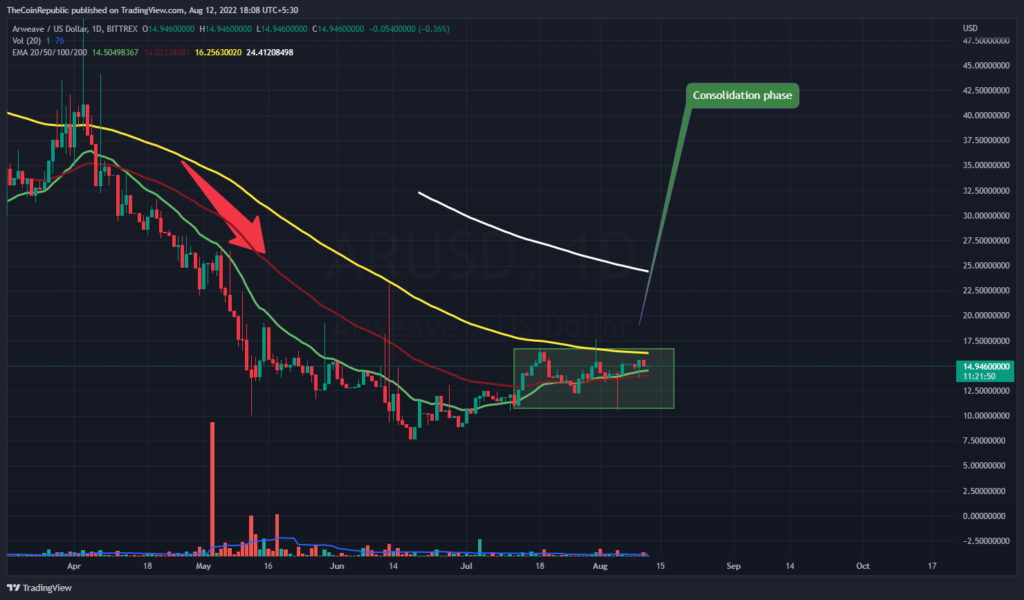
The AR coin’s price is seeking to increase demand while also attempting to maintain the upward trend shown over the daily price chart. The token must hold its present level in order for AR to ascend toward the consolidation phase’s top trendline. The token needs to break out of the consolidation phase in order to record its recovery phase. Volume change is currently below average and needs to grow in favor of bulls.
Will AR Register its Breakout from the Consolidation Phase?
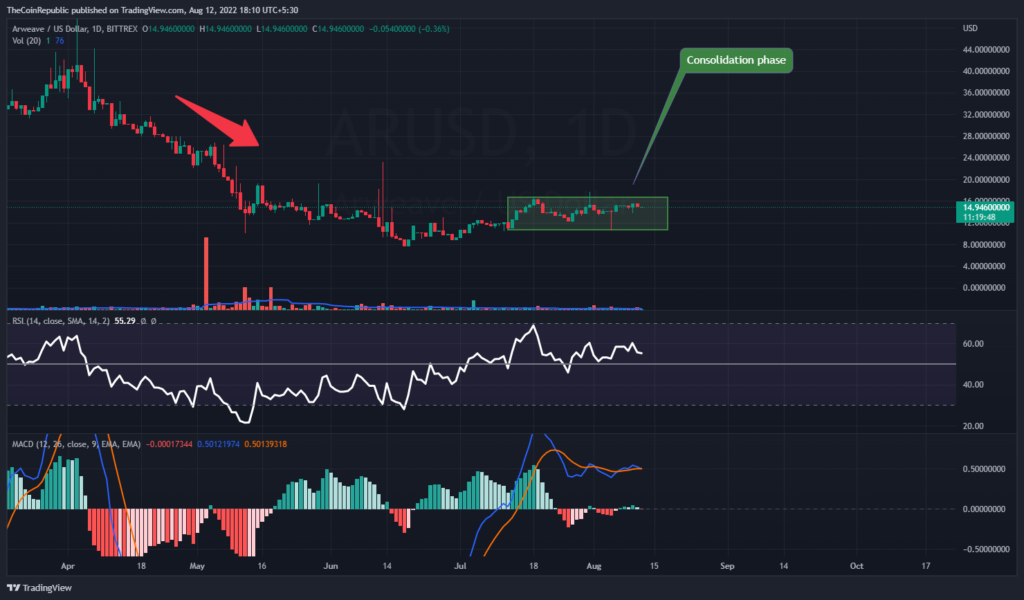
Currently, the AR coin’s price is aiming to remain stable. Buyers are entering the transaction, allowing AR currency to exit the consolidation phase. The present bullish advance of the AR currency could be stopped by bears by dragging the token back towards the lower trendline. Technical indicators point to the sideways momentum of the AR coin.
Relative Strength Index showcases the sideways momentum of AR coin. RSI is at 55 and is levitating just above neutrality. MACD exhibits the bearish momentum of the AR coin. The MACD line is about to cross the signal line downwards resulting in a negative crossover.
Conclusion
The Arweave price is trending significantly in an upbeat manner on the daily price chart. The token entered a consolidation phase on April 7th after starting to drop towards lower levels at $43. The currency is clearly moving upward as it trades towards the upper trendline, but it also seems determined to break out of the consolidation. AR investors must wait until bulls maintain their position at the edge of the region that is bound by a horizontal range. The price of the AR coin appears to be quite committed to breaking through the consolidation stage. Volume change is currently below average and needs to grow in favor of bulls.
The MACD line is about to cross the signal line downwards resulting in a negative crossover.
Technical Levels
Support Levels: $13.35 and $10.75
Resistance Levels: $15.55 and $16.65
Disclaimer
The views and opinions stated by the author, or any people named in this article, are for informational ideas only, and they do not establish the financial, investment, or other advice. Investing in or trading crypto assets comes with a risk of financial loss.

Andrew is a blockchain developer who developed his interest in cryptocurrencies while pursuing his post-graduation major in blockchain development. He is a keen observer of details and shares his passion for writing, along with coding. His backend knowledge about blockchain helps him give a unique perspective to his writing skills, and a reliable craft at explaining the concepts such as blockchain programming, languages and token minting. He also frequently shares technical details and performance indicators of ICOs and IDOs.


