
 Home
Home News
News
- The Bitcoin SV coin is fluctuating under the ascending triangle pattern.
- The trading volume increased last night by 48% at $74 Million.
- The pair price of BSV along with the BTC coin is up 3.3% at 0.00262 Satoshis.
After a scart decline bears cool down to think about sell-off of the Bitcoin SV coin. Thus crypto favors bulls for the past several days as buyers continue buying the BSV coin in dip. Nowadays, bulls seem to be exhausted near the resistance zone.

The price action of the Bitcoin SV coin draws the construction of an ascending triangle pattern in terms of the daily price scale. At the time of writing, BSV crypto is trading at $62.2 Mark with slightly sideways movement. However, the trading range of altcoin observes narrow for the past 10 days.

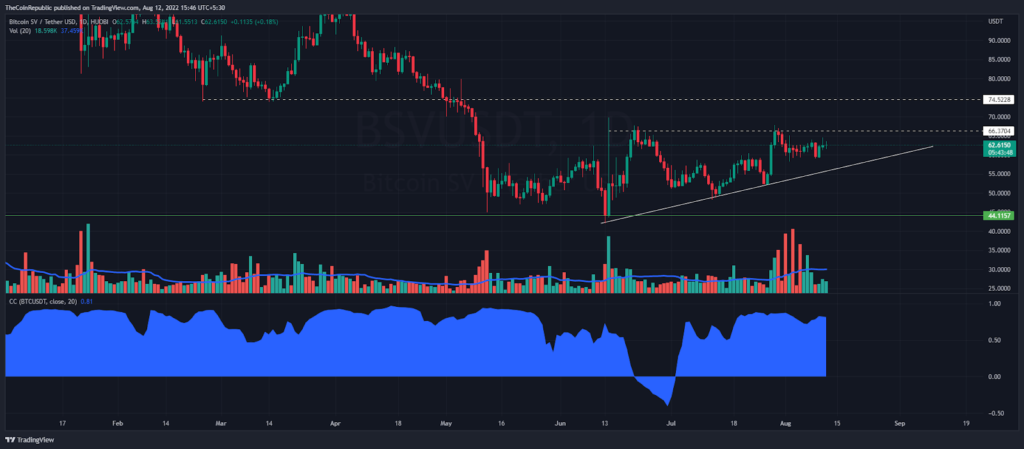
The altcoin price is exchanging just below the resistance level of the triangle pattern. If buyers breach this level with massive trading volume, then they may struggle at $70 Mark. Meanwhile, the market cap has not changed in value in the last 24 hours while it’s observing at 1.19 Billion USD.
The correlation Between BSV and BTC is very strong at 0.81 points as per the Correlation coefficient indicator. Altcoin follows the same path as a Market leader. Thus, the pair price of BSV along with the BTC coin is up 3.3% at 0.00262 Satoshis. Buying occurs because trading volume increased last night by 48% at $74 Million.
Red Zone of Volatility is Below the BSV Price
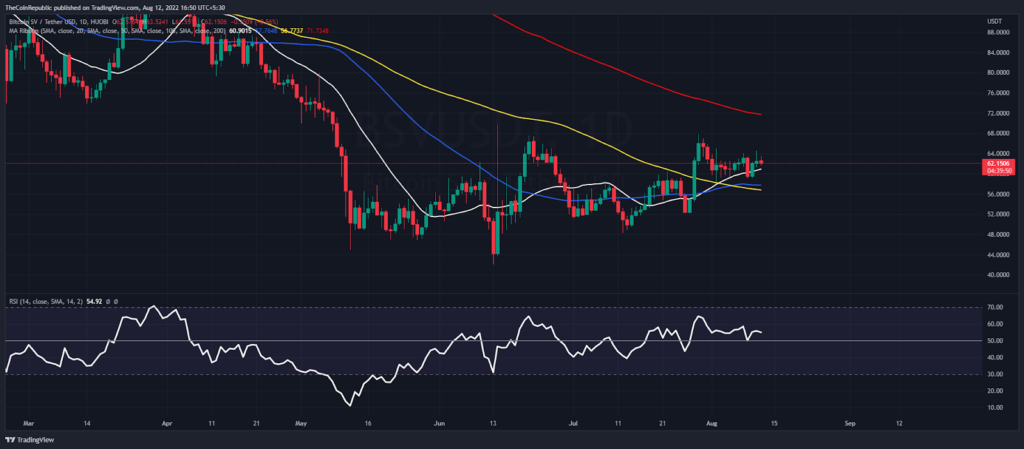
The key moving averages like 20, 50 and 100 are well below the current price of the given crypto. Meanwhile, 200-DMA will be the next way for buyers.
Thus, the RSI indicator shows little stability in the coin as its peak moves above the semi-line (50 points).
Conclusion
Bitcoin SV coin is above the uptrend line, but there could be a more bullish rally if buyers break this ascending triangle pattern upwards. Above this bullish barrier, the 200-DMA will be the next approach for buyers.
Support level – $50 and $45
Resistance level – $70 and $100
Disclaimer
The views and opinions stated by the author, or any people named in this article, are for informational ideas only, and they do not establish the financial, investment, or other advice. Investing in or trading crypto assets comes with a risk of financial loss.

Nancy J. Allen is a crypto enthusiast, with a major in macroeconomics and minor in business statistics. She believes that cryptocurrencies inspire people to be their own banks, and step aside from traditional monetary exchange systems. She is also intrigued by blockchain technology and its functioning. She frequently researches, and posts content on the top altcoins, their theoretical working principles and technical price predictions.


