
 Home
Home News
News

- The currency has started to trend in a downward direction, crushing bears’ ambitions.
- The current price of the coin is currently at $64.37 and has dropped by 5.22%
- The pair of EGLD/BTC is currently at 0.002703 and has dropped by 1.65%
The bulls tried to bring new hopes to the investors but the bears have disrupted it. The bulls have to wake up and rush the price to bring some hope to the investors. With a strong potential Ripple tried very hard to hit the upward momentum the bulls tried to push the momentum of the coin but the bears manipulated the market of the token. Both bears and bulls are hustling for the EGLD price to reach their desired goals. The fluctuating price range in the daily price chart is making it so difficult for investors to know the proper movement of the EGLD.

The current price of EGLD is $64.37 and it has dropped approx. 5.22% in the last 24 hours. Which has brought one more move towards its downward momentum. The bulls must try hard to give the uptrend momentum to the price of the coin and bring new hope to the investors in this bearish trend. The downward momentum of EGLD may bring the price to the primary support of $61.73 if the bulls don’t push themselves to raise the price and bring back the real potential of the coin. The price of the coin can break up to the secondary support at a price of $55.63. If the price of the coin reaches secondary support it would be difficult for the bulls to beat the bears. The coin may hit the primary resistance at the price of $67.92 if the bulls make it upto the mark and the price could reach the secondary resistance at the price of $78.43

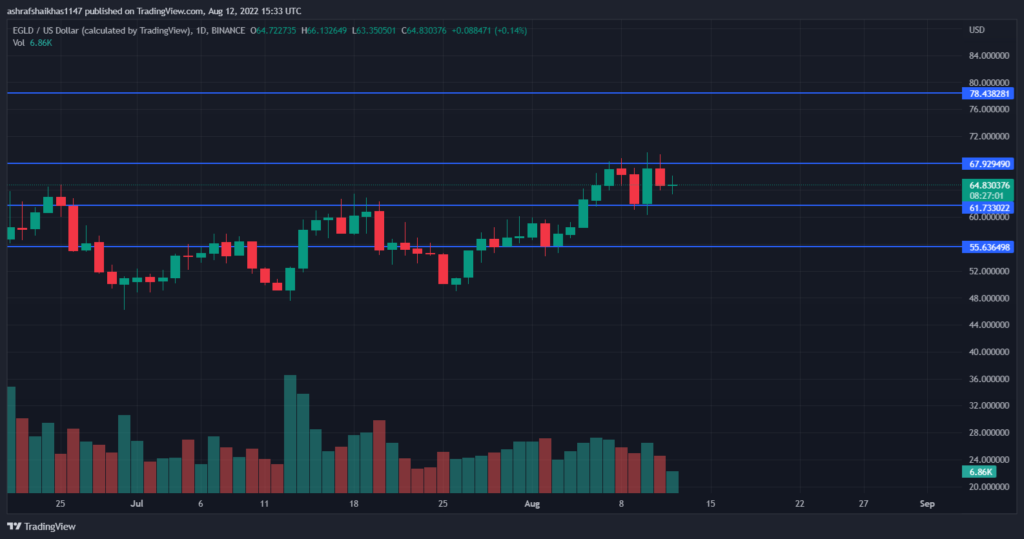
However, the volume decreased by approx. 36.13% in the intraday trading session. The continuous decrease in volume clearly indicates that the short selling pressure is increasing. The current value of the volume to market cap ratio of EGLD is 0.03253.
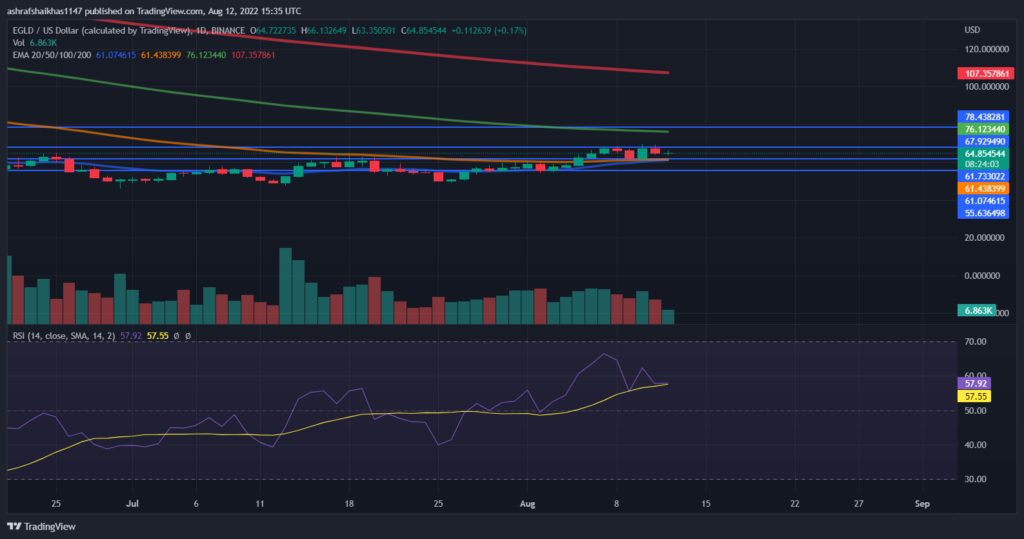
The technical indicator shows the following: The Relative Strength Index is returning from the overbought territory but the buyers are trying to push the rsi to the overbought zone. The current RSI is 58.08. which is above the average RSI of 57.55. The bulls worked hard to get the RSI to the overbought zone. However, the stillness of the bears is an advantage for the bulls to prepare for their desired goals and pushed the RSI into the overbought zone. The bears have to go some extra miles to take it towards neutrality. The coin’s price remains above the 20,50 Exponential moving and is still lagging behind the 100,200 Daily Moving Average.
Technical Levels
Support Levels:$61.73 and $51.63
Resistance Levels: $67.92 and $78.43
Disclaimer
The views and opinions stated by the author, or any people named in this article, are for informational ideas only. They do not establish the financial, investment, or other advice. Investing in or trading crypto assets comes with a risk of financial loss.

Andrew is a blockchain developer who developed his interest in cryptocurrencies while pursuing his post-graduation major in blockchain development. He is a keen observer of details and shares his passion for writing, along with coding. His backend knowledge about blockchain helps him give a unique perspective to his writing skills, and a reliable craft at explaining the concepts such as blockchain programming, languages and token minting. He also frequently shares technical details and performance indicators of ICOs and IDOs.


