
 Home
Home News
News

- Ethereum Classic coin is set to hit the 4-month top again this week.
- The mid-band of the Bollinger Bands indicator acted well as support for the ETC bulls.
- Trading volume increased by 94% to $2.7 billion in the last 24 hours.
Investors continue to push asset prices higher as a result of Ethereum Classic following the path of Ethereum Crypto. The ETC cryptocurrency completed its short-term retracement cycle after a robust surge last week. The cryptocurrency has been somewhat positive over the last two days, with buyers seeing a 10.9% gain this week.

The price of Ethereum Classic Coin in USDT is $41.8 at the time of publication. However, after the bullish surge of the previous five weeks, buyers turn to collecting force for a brief period of time. There is no sell signal in the weekly time frame, while buyers served a minor retreat in the lower timescale.

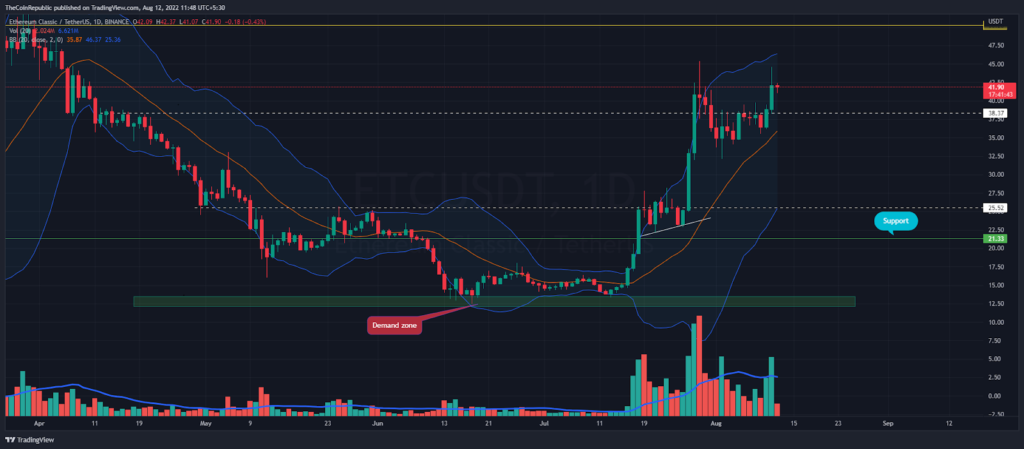
The mid-band of the Bollinger Bands indicator acted as a major pumping area for the bulls after ETC price pushed above it. Now the bulls are approaching the upper band of the given indicator. Last time the bulls witnessed a pullback at the upper level of the indicator, now the bulls need to maintain stability near this bullish barrier.
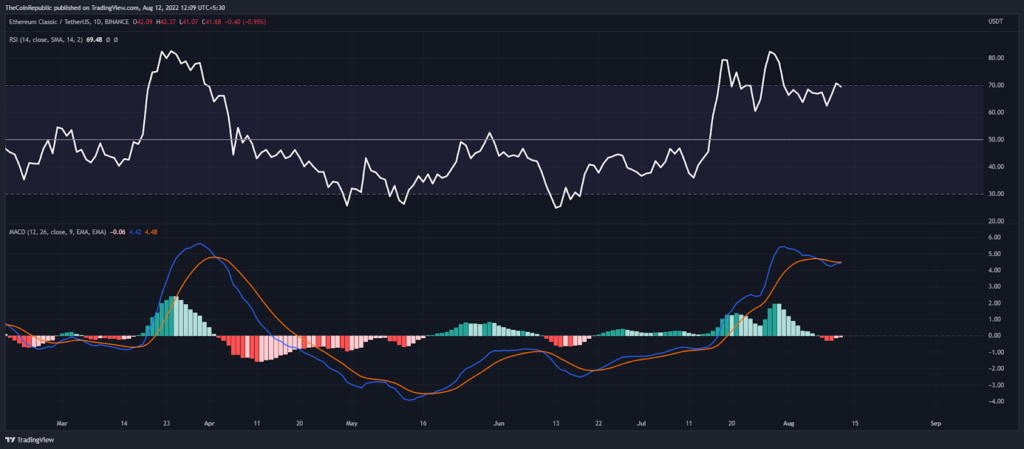
RSI is Remaining Into the Higher Territory
Trading volume increased by 94% to $2.7 billion in the last 24 hours. Thus, the market cap against USDT is up 7.5% at USD 5.6 billion as per CMC. Moreover, the price of ETC pairing with ETH is in the 7.5% Green Zone at 0.02209 ETH.
The RSI indicator remains in the overbought zone, with the MACD indicator moving into the positive zone.
Conclusion
The Ethereum Classic is trading with volatility near 90 day high. It looks like sellers are active near the $45-resistance mark. Despite this fact, there is an important support level for the bulls at the mid-band of the Bollinger Bands indicator.
Support level – $25 and $20
Resistance level – 45 and $75
Disclaimer
The views and opinions stated by the author, or any people named in this article, are for informational ideas only. They do not establish financial, investment, or other advice. Investing in or trading crypto assets comes with a risk of financial loss.
Steve Anderson is an Australian crypto enthusiast. He is a specialist in management and trading for over 5 years. Steve has worked as a crypto trader, he loves learning about decentralisation, understanding the true potential of the blockchain.


