
 Home
Home News
News
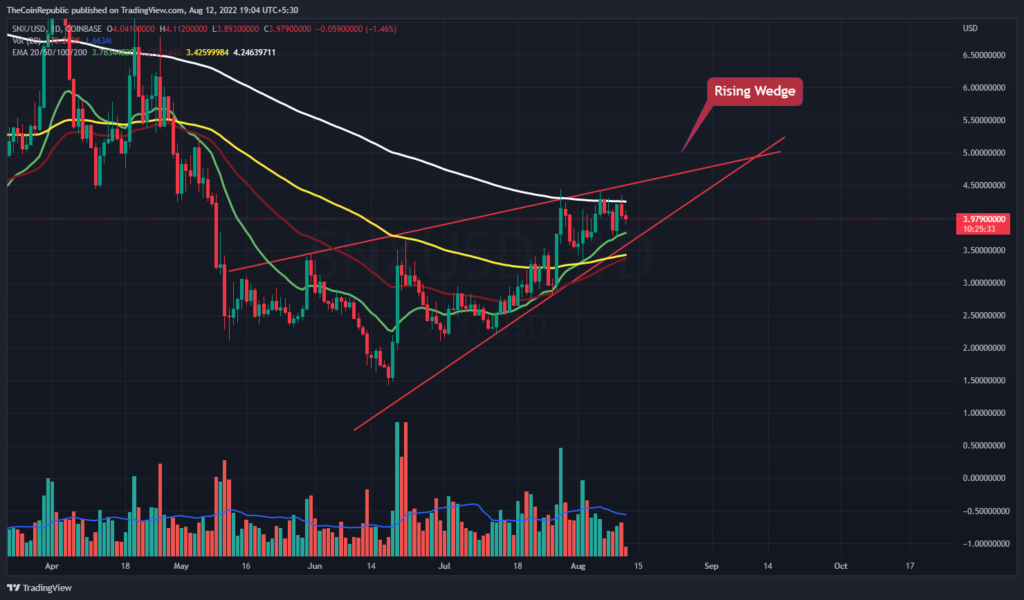
- Synthetic price is rising through a rising wedge pattern over the daily price chart.
- SNX crypto is trading above 20, 50 and 100-days Daily Moving Average.
- The pair of SNX/BTC is at 0.0001678 BTC with an intraday gain of 0.13%.
Synthetic price is trading with downtrend momentum towards the lower trendline of the rising wedge pattern over the daily price chart. The token must maintain itself inside the rising wedge pattern to surge towards its recovery phase. The token must maintain its recovery phase inside the rising pattern. However, bears are trying to trap the token in the short-sellers’ clutch. SNX crypto must attract more buyers in order to sustain inside the rising wedge pattern. SNX investors need to wait until SNX crypto starts recovering itself over the daily price chart.

In the last 24 hours, Synthetix’s price, which is currently estimated at $3.97, has lost 3.48% of its market value. The trading volume of the SNX currency has decreased by 47.55% in one day. This indicates the SNX coin’s significant decline in momentum. Volume to market cap ratio is 0.1697.

As it has dropped below the accumulation level of the consolidation phase, the price of the SNX coin is attempting to find support from buyers. To adjust the upward momentum and return to the upper level ahead of the rising wedge pattern, the coin needs to assemble support from buyers. The volume change, however, can be shown to be below normal and bear-influenced. For the token to enter its recovery phase, SNX bulls must accumulate.
What do Technical Indicators suggest about SNX?
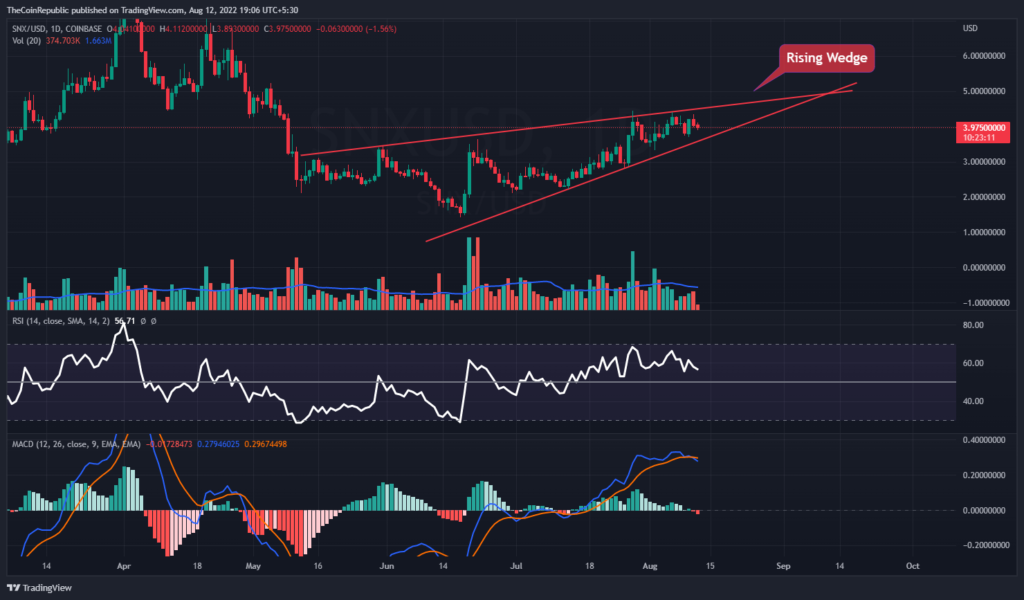
To recover from the rising wedge pattern’s lower trendline, the price of the SNX cryptocurrency has to gain support from bulls. For the token to surpass the daily chart, it still needs to draw in a sizable number of buyers. Technical indicators point to the strength of the SNX coin’s downturn.
Relative Strength Index showcases the downtrend momentum of SNX crypto. RSI is at 57 and is heading towards neutrality. MACD exhibits the downtrend momentum of the SNX coin. The MACD line is below the signal line after a negative crossover. SNX investors need to wait for any directional change over the daily chart.
Conclusion
Synthetic price is trading with downtrend momentum towards the lower trendline of the rising wedge pattern over the daily price chart. The token must maintain itself inside the rising wedge pattern to surge towards its recovery phase. The token must maintain its recovery phase inside the rising pattern. However, bears are trying to trap the token in the short-sellers’ clutch. The volume change, however, can be shown to be below normal and bear-influenced. For the token to enter its recovery phase, SNX bulls must accumulate. The MACD line is below the signal line after a negative crossover. SNX investors need to wait for any directional change over the daily chart.
Technical levels
Support Levels: $3.70 and $3.60
Resistance Levels: $4.35 and $4.45
Disclaimer
The views and opinions stated by the author, or any people named in this article, are for informational ideas only, and they do not establish the financial, investment, or other advice. Investing in or trading crypto assets comes with a risk of financial loss.

Nancy J. Allen is a crypto enthusiast, with a major in macroeconomics and minor in business statistics. She believes that cryptocurrencies inspire people to be their own banks, and step aside from traditional monetary exchange systems. She is also intrigued by blockchain technology and its functioning. She frequently researches, and posts content on the top altcoins, their theoretical working principles and technical price predictions.


