
 Home
Home News
News

- The FTT has started to follow the upward curve with a dominance of the bullish trend
- The current price of the FTT is currently at $31.42
- The pair of FTT/BTC is around 0.001284 BTC
The FTT is getting upward momentum, the bullish dominance could bring new opportunities for investors to book profit over the coin, and the price is moving towards the desired targets of the bulls. The bears will try to get involved in the trade and bring the bullish trend. FTT is breaking the bears’ back and gaining some upward momentum now it’s time to check how the bears will overcome this bite to dust.

The price of FTT is currently at $31.41 and it has increased by a total of3.44% during the intraday trading session. The bulls seem to run the trade. This may lead the price to reach the primary resistance of $31.85 and this price could break up to the secondary resistance of $32.74. If the bulls pull the trigger, the bears will have defeated the bulls tooth and nail. If the bear somehow succeeds in stepping up to the plate, it will be a crisis for the bulls, who will exert all of their effort to achieve their desired targets and put the ball in their favor, and may accomplish their targets. This might lead the price to drop to the primary support of $29.73, if the bull’s calmness from earlier sessions holds, the price may drop towards the secondary support of $28.84 The bears will have a hard time getting to their desired targets.

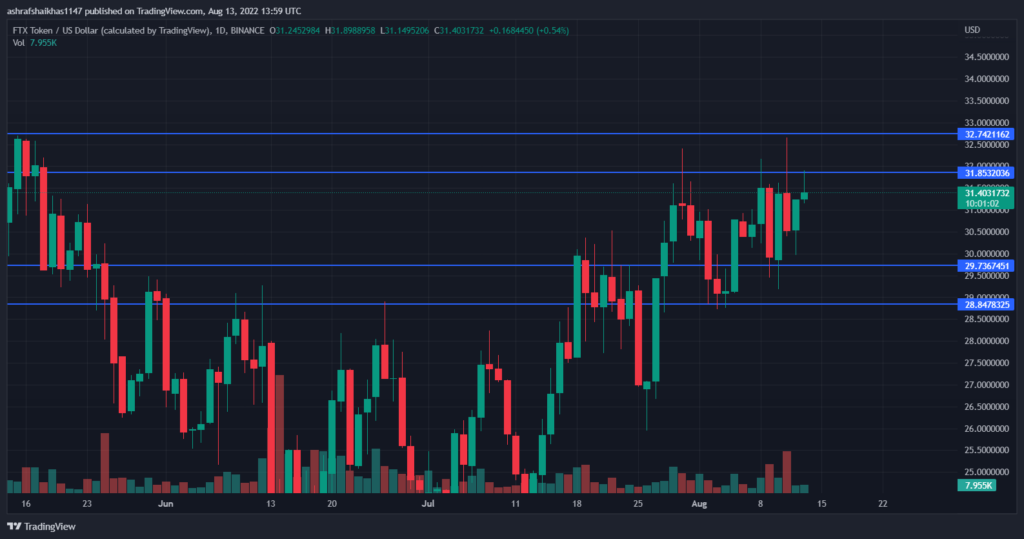
There has been a decrease in volume of almost 23.87%. The volume has been steadily increasing which indicates that the short-selling pressure is decreasing on the coin, and buyers are working too hard to increase the buying pressure. The bullish trend has begun to go forward as the bulls have begun to trade. The market cap to volume ratio is 0.0.7687
What do technical indicators suggest about the FTX Token?
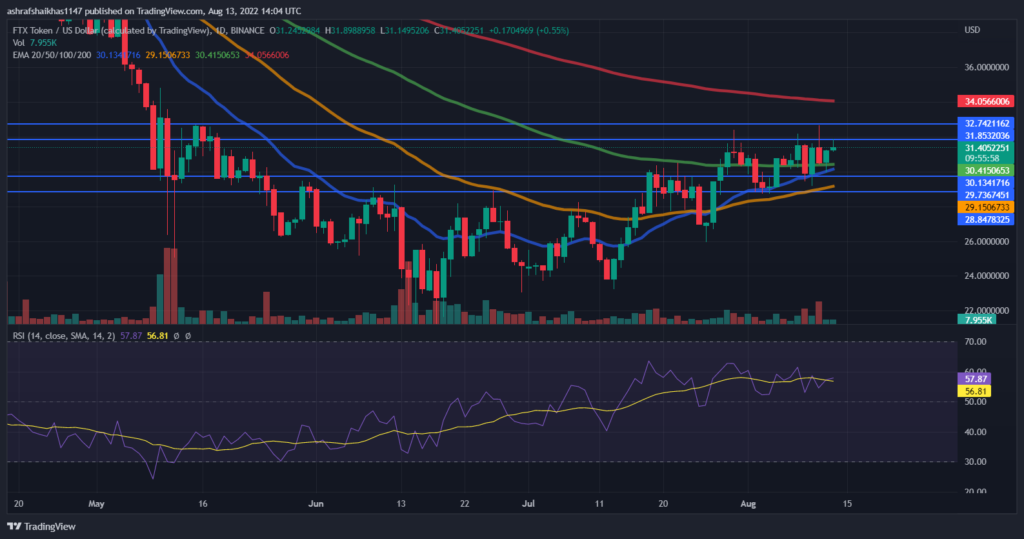
The technical indicator shows the following: The relative strength index is getting close to being overbought. The current RSI, which is 57.87 is higher than the average RSI, which is 56.81. Bulls put a lot of effort into pushing the RSI towards the overbought region. And the coin has reached the over brought zone. But the bears were inconsistent, the bulls had time to prepare for their goals and the RSI entered the overbought zone. The bears will need to exert more effort to neutralize the RSI. The price of the coin is still higher than the 20,50,100 Exponential Moving Average and is still lagging from the 200 Daily Moving Average. Investors in FTT rely on the bulls to keep their aspirations alive. However, the bullish trend is increasing investors’ expectations.
Technical Levels
Support Levels: $29.73 and $28.84
Resistance Levels: $31.82 and $32.64
Disclaimer
The views and opinions stated by the author, or any people named in this article, are for informational ideas only. They do not establish financial, investment, or other advice. Investing in or trading crypto assets comes with a risk of financial loss.

Nancy J. Allen is a crypto enthusiast, with a major in macroeconomics and minor in business statistics. She believes that cryptocurrencies inspire people to be their own banks, and step aside from traditional monetary exchange systems. She is also intrigued by blockchain technology and its functioning. She frequently researches, and posts content on the top altcoins, their theoretical working principles and technical price predictions.


