
 Home
Home News
News

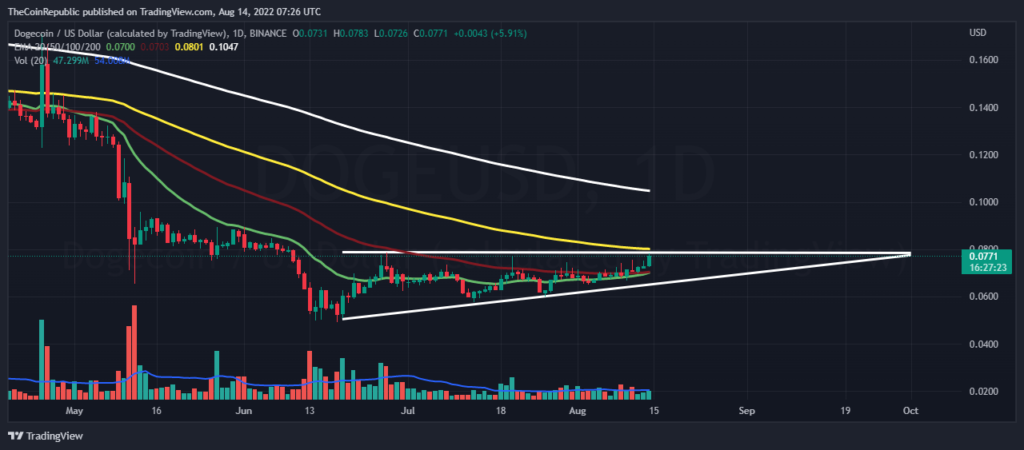
- The DOGE price has entered an ascending triangle pattern over the daily price chart after experiencing a bearish trend.
- Now it is just a matter of time to see if the Bulls can make a Breakout or continue trading inside the Triangle.
- The DOGE/BTC pair is at 0.000003116 BTC with a significant gain of 4.17%.
After falling under a bearish movement the DOGE price has now entered in an ascending triangle pattern over the daily price chart. Bulls playing their part are pushing the price towards the upper arm for a breakout. We can observe the bearish interruption in the process, and to avoid this the bulls need to gather in a good number and make some constant efforts to make breakout a successful event.

Whereas one of the major reasons for this uplift in the market is the domination by BTC as yesterday the BTC price touched the mark of 24,800, which made the rest of altcoins rally bullish. Now the DOGE price is at the verge of a breakout just waiting for accumulation of some buyers.

The current price for one DOGE coin is trading at $0.077 which is at a significant gain of 4.53% in its market capitalization in the last 24 hrs. The coin has a trading volume of 599 million which is at a massive gain of 33.57% in the 24 hrs trading session and has a market cap of 10 billion. The volume market cap ratio is 0.05791.
Should Investors Expect a Breakout?
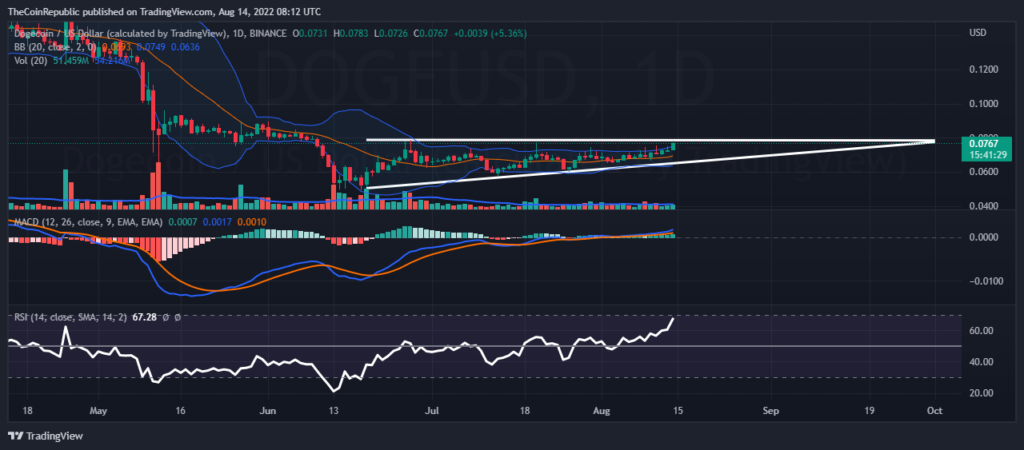
We can observe an uptrend movement over the daily and short term (4 hrs) price chart. As such, over the daily chart we can observe a fresh positive cross over the multiple EMA, which drives the expectations of investors high.
The MACD over the daily chart shows the buyers line is moving above the sellers signal line and now the gap between the 2 lines is increasing gradually with the green histograms. The relative strength index supporting the same is now approaching the overbought, due to which the sellers might get attracted. The RSI value is moving above 65.
Conclusion
After falling under a bearish movement the DOGE price has now entered in an ascending triangle pattern over the daily price chart. A major reason behind this upliftment is the domination of BTC over the market, which made all other altcoins rally bullishly. Now the price is at the verge of a breakout whereas the technical indicators superficially indicate a backlash as the high prices can attract sellers.
Technical levels
Resistance levels: $0.085 and $0.091
Support levels: $0.067 and $0.059
Disclaimer
The views and opinions stated by the author, or any people named in this article, are for informational ideas only, and they do not establish the financial, investment, or other advice. Investing in or trading crypto assets comes with a risk of financial loss.

Nancy J. Allen is a crypto enthusiast, with a major in macroeconomics and minor in business statistics. She believes that cryptocurrencies inspire people to be their own banks, and step aside from traditional monetary exchange systems. She is also intrigued by blockchain technology and its functioning. She frequently researches, and posts content on the top altcoins, their theoretical working principles and technical price predictions.


